What is the RSI?
J. Welles Wilder introduced the RSI in 1978, in the same book as the ADX and the Parabolic SAR. It answers one question: over the last 14 periods, have the up days or the down days been bigger? If every day was an up day, RSI is 100; if every day was a down day, it is 0; if gains and losses were the same size, it is 50.
Because it is bounded between 0 and 100, RSI readings can be compared across time and across stocks, unlike MACD, which is measured in dollars, or the unbounded CCI. That makes it the standard tool for asking whether a move has gone too far, too fast.
RSI formula
Each day’s price change is split into a gain (if the close was higher) or a loss (if it was lower), then both are smoothed with Wilder’s method, which works like an EMA with smoothing factor 1/14:
Gain = close − previous close if positive, else 0 · Loss = previous close − close if positive, else 0 · the first averages are simple averages of the first 14 days
An equivalent form is RSI = 100 × Avg gain / (Avg gain + Avg loss): the share of the total recent movement that went up.
Worked example: two days of RSI
Yesterday a stock’s 14-day average gain was $0.20 and its average loss $0.30, so RS = 0.667 and RSI = 40. Today it closes $0.50 higher; tomorrow $0.80 lower.
| Day | Change | Avg gain | Avg loss | RS | RSI |
|---|---|---|---|---|---|
| Yesterday | – | 0.2000 | 0.3000 | 0.667 | 40.00 |
| Today | +0.50 | (13 × 0.20 + 0.50) / 14 = 0.2214 | (13 × 0.30 + 0) / 14 = 0.2786 | 0.795 | 44.29 |
| Tomorrow | −0.80 | (13 × 0.2214 + 0) / 14 = 0.2056 | (13 × 0.2786 + 0.80) / 14 = 0.3158 | 0.651 | 39.43 |
Each new day carries 1/14 of the weight, so one big move shifts RSI by a few points rather than resetting it. Note also that on a day with a gain, the average loss still changes: it shrinks by 1/14 because that day’s loss was zero.
What RSI levels mean
| RSI | Reading |
|---|---|
| Above 70 | Overbought: gains have far outweighed losses; the move may be stretched |
| 50 – 70 | Bullish momentum; in uptrends RSI tends to hold above 40–50 on pullbacks |
| 30 – 50 | Bearish momentum; in downtrends RSI tends to fail at 50–60 on rallies |
| Below 30 | Oversold: losses have far outweighed gains; the move may be stretched |
| 80 / 20 | Stricter thresholds some traders use in strong trends or on volatile stocks |
“Overbought” does not mean “about to fall”. In a strong uptrend RSI can stay above 70 for weeks, and in a strong downtrend below 30. The levels say a move is extended, not that it is over.
Reading RSI on a chart: Ford (F)
The daily chart of Ford (F) below covers one year. The upper panel shows price with the 10, 50 and 200-day SMAs; the lower panel shows RSI (14) in purple, with the 30–70 band shaded and a dashed line at 50.
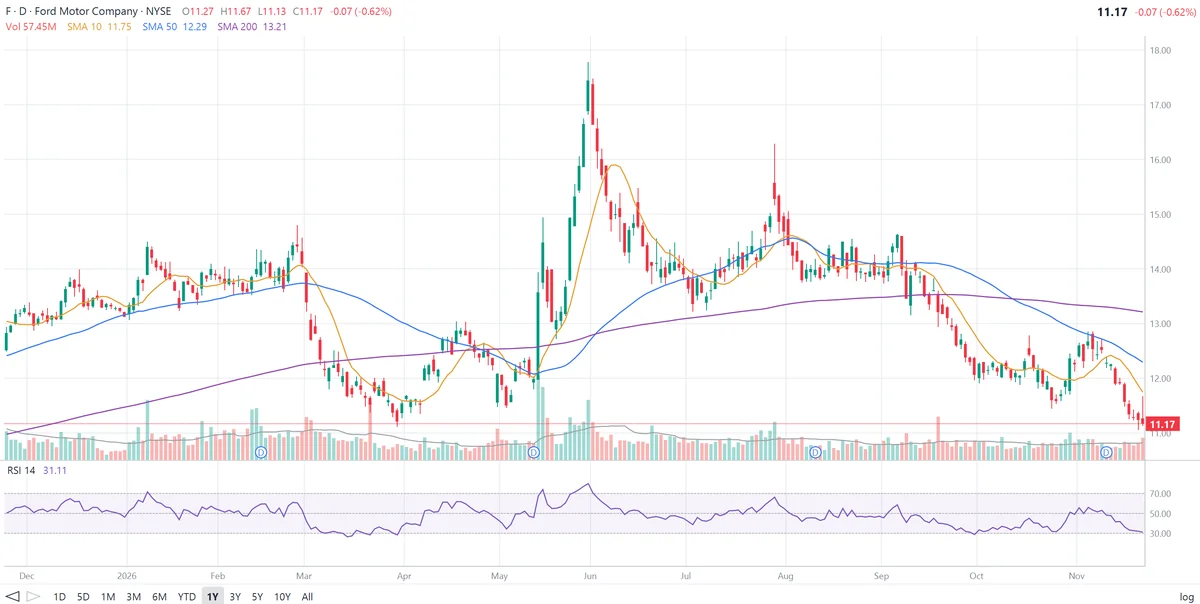
What RSI shows on this chart:
- A bearish divergence. In early January a jump to about $14.50 pushed RSI to 72, its only overbought reading of the winter. In late February Ford made a higher high near $14.80, but RSI peaked at only about 60. Price was higher, momentum was weaker. In March the stock fell to about $11.
- Oversold can stay oversold. Through most of March RSI sat at or below 30, touching about 27, while Ford kept falling. Buying the first oversold reading in early March would have meant buying around $12.30 and watching the stock drop another 10%.
- A bullish divergence at the low. In mid-March Ford fell to about $11.60 with RSI near 27. At the end of March it made a lower low near $11.10, but RSI only got to about 29, a higher low. Momentum was improving before price turned, and in April Ford rallied to about $13.
- The strongest move of the year. In mid-May Ford jumped from about $12 toward $15 and RSI reached 74. By the end of May it was near $17.80 and RSI hit about 80, the year’s high. Overbought readings here were a sign of strength, not an immediate sell signal, but the run ended within days and Ford gave back most of it by early July.
- Momentum fading. The late-July spike to about $16.30 got RSI only to about 67. Through August and September RSI hovered around 45–55 while Ford traded sideways, then slid to about 32 in early October as the stock fell to $12. A rebound to about $12.80 in early November lifted RSI to only about 55 and stalled at the 50-day SMA.
- The latest reading. RSI is 31.11 with Ford at $11.17, back near its March low and below its 10, 50 and 200-day SMAs. It is close to oversold but not there yet. Price is near the March lows while RSI is above March’s 27–29, which is the start of a possible bullish divergence; it would only count if price makes a new low and RSI does not.
How traders use RSI
1. Overbought and oversold
The classic signal: sell when RSI crosses back below 70 from above, buy when it crosses back above 30 from below. Waiting for the cross back, rather than acting at the first touch, avoids some of the losses from buying into a falling market, as in Ford’s March.
2. Divergence
Price making a higher high with RSI making a lower high (bearish) or a lower low with RSI making a higher low (bullish) shows momentum disagreeing with price. Ford’s February top and March bottom are both examples.
3. Centerline (50)
RSI above 50 means average gains exceed average losses: bullish momentum. Crossing 50 is used as a trend filter; in uptrends, pullbacks that hold RSI above 40–50 often make good entries.
4. Failure swings
Wilder’s own signal: RSI goes above 70, pulls back, rallies again but fails to get back above 70, then breaks below its pullback low. The mirror image below 30 is a bullish failure swing. It doesn’t need price confirmation, only RSI.
5. RSI ranges
In uptrends RSI tends to move between about 40 and 80; in downtrends between about 20 and 60. When the range shifts, for example RSI failing at 55–60 after months of reaching 70, the trend itself may be changing.
RSI settings
| Period | Use |
|---|---|
| 14 (standard) | Wilder’s default, used on almost every chart |
| 7 or 9 | Faster; reaches 70 and 30 more often; short-term trading |
| 21 or 25 | Smoother; fewer extremes; longer-term trends |
| 2 | Very short-term mean reversion: buy pullbacks when RSI(2) drops below 10 in an uptrend |
Many charting tools also offer a Stochastic RSI, which applies the stochastic formula to RSI to make it even more sensitive.
Limitations of RSI
- Extremes can last. RSI can stay overbought or oversold through an entire trend, so the 70/30 levels on their own often give early, losing signals.
- Divergences can fail. Momentum can weaken for weeks while price keeps going, and a divergence only matters once price confirms it.
- Close-to-close only. RSI uses closing prices and ignores intraday highs, lows and gaps beyond their effect on the close.
- Not the same as relative strength. RSI compares a stock with its own past. Relative strength in the usual sense compares a stock with the market or another stock.
- Not a prediction. Combine RSI with trend, support and resistance, volume and the company’s fundamentals.
Frequently asked questions
What is the RSI indicator?
The Relative Strength Index (RSI) is a momentum oscillator developed by J. Welles Wilder that compares the size of recent gains with the size of recent losses. It moves between 0 and 100; readings above 70 are traditionally called overbought and readings below 30 oversold.
How is RSI calculated?
Split each day’s price change into a gain or a loss, smooth both over 14 periods with Wilder’s method, divide average gain by average loss to get RS, and compute RSI = 100 − 100 / (1 + RS).
Is an RSI below 30 a buy signal?
Not by itself. An RSI below 30 means the stock has fallen hard relative to its recent gains, but in a strong downtrend RSI can stay below 30 for weeks while price keeps falling. Many traders wait for RSI to turn back above 30, or for a bullish divergence, before acting.
What is RSI divergence?
A bearish divergence is when price makes a higher high but RSI makes a lower high, showing weaker upward momentum. A bullish divergence is when price makes a lower low but RSI makes a higher low. Divergences are early warnings, not confirmed reversals.
What is the best RSI setting?
Wilder’s 14-period setting is the standard. Shorter periods such as 7 or 9 make RSI more sensitive and reach extremes more often; longer periods such as 21 or 25 make it smoother. Very short settings such as a 2-period RSI are used for short-term mean-reversion trades.
Is RSI the same as relative strength against the market?
No. RSI compares a stock’s gains with its own losses. Relative strength in the comparative sense compares a stock’s performance with an index or another stock. The names are similar, but the measures are different.