- What it is
- Formula
- Worked example
- Three parts
- Reading the chart
- Trading signals
- Settings
- Limitations
- FAQ
What is MACD?
MACD stands for Moving Average Convergence Divergence. Developed by Gerald Appel in the late 1970s, it takes the 12-period EMA of the closing price and subtracts the 26-period EMA. When the fast average pulls away above the slow one (the averages diverge), MACD rises; when the two come back together (they converge), MACD falls back toward zero.
Because the 12-period EMA reacts faster than the 26-period EMA, the gap between them measures momentum: how quickly price is moving, not just which way. A rising MACD means the up-move is accelerating or the down-move is slowing; a falling MACD means the opposite.
MACD formula
The indicator has three lines, each built from the one before:
P = closing price · EMAn = n-period exponential moving average, smoothing factor 2 / (n + 1)
The standard settings are written as MACD(12, 26, 9): fast EMA, slow EMA, signal EMA. MACD is measured in the same units as price, dollars for a US stock, so its values depend on how expensive the stock is.
Worked example: three days of MACD
Suppose that before day 1 a stock’s 12-period EMA is $52.00, its 26-period EMA is $51.00, and the signal line is 0.80. The smoothing factors are 2/13 for the 12-period EMA, 2/27 for the 26-period EMA and 2/10 = 0.2 for the signal line.
| Day | Close | EMA 12 | EMA 26 | MACD | Signal | Histogram |
|---|---|---|---|---|---|---|
| before | – | 52.00 | 51.00 | 1.00 | 0.80 | 0.20 |
| 1 | $54.00 | 52.31 | 51.22 | 1.09 | 0.86 | +0.23 |
| 2 | $51.00 | 52.11 | 51.21 | 0.90 | 0.87 | +0.03 |
| 3 | $49.00 | 51.63 | 51.04 | 0.59 | 0.81 | −0.22 |
Day 1, step by step: EMA 12 = 52.00 + (2/13) × (54 − 52.00) = 52.31; EMA 26 = 51.00 + (2/27) × (54 − 51.00) = 51.22; MACD = 52.31 − 51.22 = 1.09; signal = 0.80 + 0.2 × (1.09 − 0.80) = 0.86; histogram = 1.09 − 0.86 = 0.23.
On day 2 the stock falls, the fast EMA drops more than the slow one, and MACD shrinks to 0.90, barely above the signal line. On day 3 MACD falls below the signal line and the histogram turns negative: a bearish signal-line crossover. Note that MACD itself is still positive (the 12-period EMA is still above the 26-period EMA): momentum has turned down, but the medium-term trend hasn’t yet.
The three parts of MACD
- MMACD line12-period EMA minus 26-period EMA. Above zero, the fast EMA is above the slow one; below zero, it’s below.
- SSignal line9-period EMA of the MACD line. A slower copy of MACD that the MACD line crosses at turning points.
- HHistogramMACD minus signal, drawn as bars. Above zero when MACD is above the signal line; its bars shrink before a crossover.
A useful way to think about it: the MACD line is the speed of the trend, and the histogram is how that speed is changing. The histogram often peaks and starts to shrink before price tops out, which is why many traders watch it for early warning, even though it gives more false signals than the MACD line.
Reading MACD on a chart: General Motors (GM)
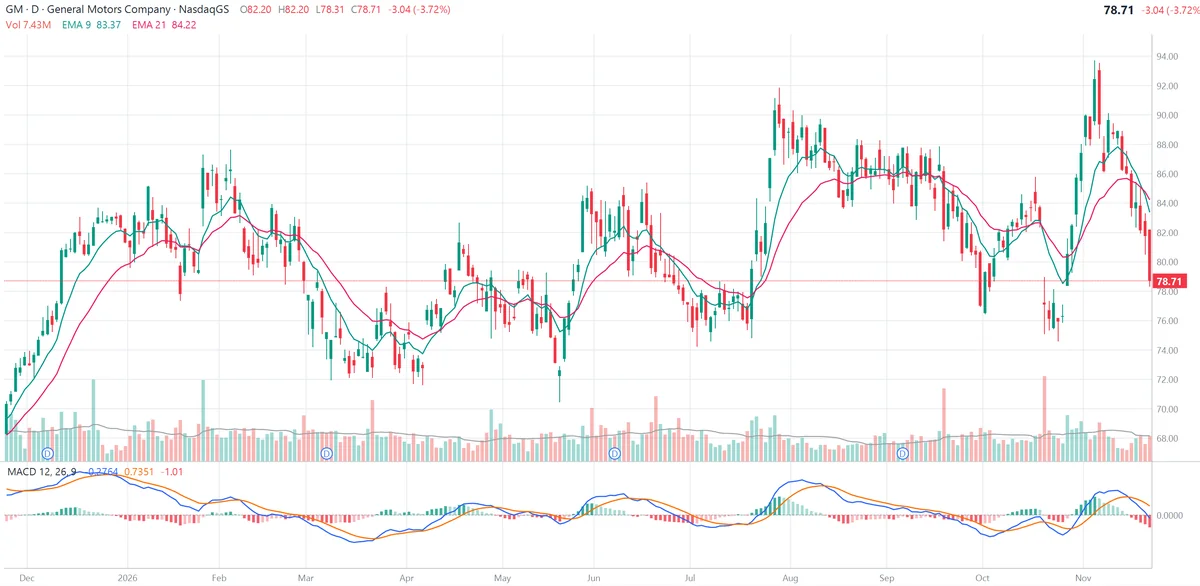
The daily chart of General Motors (GM) below covers one year. The upper panel shows price with the 9-period EMA (green) and the 21-period EMA (red); the lower panel shows MACD(12, 26, 9): MACD line in blue, signal line in orange, histogram in green (positive) and red (negative).
The 9/21 EMA pair is a little faster than MACD’s own 12/26 pair, but it shows what MACD measures: when the green EMA pulls away above the red one, MACD climbs; when the two lines converge and cross, MACD falls back to around zero.
What MACD shows on this chart:
- Strong trend, high MACD. GM’s December rally from about $70 to $83 pushed MACD to one of its highest readings of the year, with the histogram green throughout. A big, rising MACD means price is pulling away from its averages quickly.
- A bearish divergence. In early February GM made a new high near $87, above its January highs, but MACD peaked well below its December–January level. Price was still rising, but momentum was fading. In March GM dropped to about $72.
- Signal-line crossovers at the turns. MACD reached its low of the year in late March and crossed back above the signal line in early April, close to the $72 bottom. It crossed above zero (the 12-period EMA moving above the 26-period EMA) later in April.
- A momentum peak that came early. The late-July jump to about $92 produced MACD’s highest reading of the year in early August. Through August and September GM held between roughly $85 and $90, yet MACD slid steadily toward zero: in a sideways market the two EMAs converge, so MACD falls even when price doesn’t. The drop to the high $70s followed in October.
- A crossover from below zero. In late October GM fell back to about $75 while MACD held its earlier low and crossed above the signal line. A rally to about $94 in early November followed, the high of the year.
- The latest move. After that high, GM gave back about $15. On the price panel the 9-EMA ($83.37) has already crossed below the 21-EMA ($84.22), and price sits more than 5% under both. MACD crossed below its signal line in mid-November and is falling to the zero line with a widening red histogram. A MACD cross below zero would confirm that the slower 12/26 pair has turned the same way as the 9/21 pair.
MACD trading signals
1. Signal-line crossover
The most common signal: MACD crossing above the signal line is bullish, crossing below is bearish. The histogram shows the same thing: it changes from red to green or back exactly at the crossover. Signals are most reliable in the direction of the larger trend, for example taking bullish crossovers only while price is above its 200-day average.
2. Zero-line crossover
MACD crossing above zero means the 12-period EMA has crossed above the 26-period EMA; crossing below zero means the opposite. This is slower than a signal-line crossover and is used to confirm a trend change rather than to time it.
3. Divergence
A divergence is when price and MACD disagree. Price making a higher high while MACD makes a lower high (a bearish divergence, as on GM in February) warns that an uptrend is losing steam; price making a lower low while MACD makes a higher low (a bullish divergence) warns that a downtrend is tiring. Divergences are early warnings, not triggers: they can last for weeks before price turns.
4. Histogram turns
When the histogram stops growing and its bars start to shrink, momentum is slowing even though the MACD line is still moving the same way. Some traders act on that first shrinking bar to get in or out before the crossover.
5. Distance from zero
A MACD far above zero means price has risen well above its recent averages and the move may be stretched; far below zero, the opposite. Because MACD is in price units, “far” has to be judged against the same stock’s own history, not against other stocks.
MACD settings
| Settings | Speed | Use |
|---|---|---|
| 12, 26, 9 | Standard | Default on almost every chart; the version most traders watch |
| 8, 17, 9 | Faster | Earlier signals for short-term traders, more whipsaws |
| 5, 35, 5 | Faster signal, wider spread | More sensitive crossovers while still tracking a longer trend |
| 12, 26, 9 on weekly bars | Slow | Long-term momentum; one signal every few months |
Changing the settings moves the trade-off between early signals and false signals, the same trade-off as choosing a period for any moving average.
MACD vs related indicators
- Moving average crossover: a MACD zero-line cross is exactly a 12/26 EMA crossover. MACD just shows the gap between the two averages as a line, so you can see it growing or shrinking before the cross.
- PPO (Percentage Price Oscillator): the same calculation divided by the 26-period EMA, so values are in percent and can be compared across stocks and across long periods.
- RSI and stochastics: bounded oscillators (0 to 100) that flag overbought and oversold levels. MACD has no fixed bounds, so it is better at showing trend momentum than extremes.
Limitations of MACD
- It lags. MACD is built from moving averages and its signal line is an average of an average, so crossovers come after price has already turned.
- Whipsaws in ranges. When price moves sideways, MACD hovers around zero and the lines cross back and forth.
- No fixed overbought or oversold levels. Values depend on the stock’s price, so there is no universal “too high”.
- Divergences can persist. A strong trend can show divergence for a long time before it actually reverses.
- Not a prediction. Confirm MACD signals with price action, volume, support and resistance, and the company’s fundamentals.
Frequently asked questions
What is the MACD indicator?
MACD (Moving Average Convergence Divergence) is a momentum indicator that shows the difference between a 12-period and a 26-period exponential moving average of price. A 9-period EMA of that difference, the signal line, and a histogram of the gap between the two are plotted with it.
How is MACD calculated?
MACD line = 12-period EMA − 26-period EMA of the closing price. Signal line = 9-period EMA of the MACD line. Histogram = MACD line − signal line.
What does a MACD crossover mean?
When the MACD line crosses above the signal line, momentum is turning up and many traders read it as a buy signal; a cross below the signal line is read as a sell signal. A cross of the MACD line above or below zero means the 12-period EMA has crossed the 26-period EMA.
What is MACD divergence?
A bearish divergence is when price makes a higher high but MACD makes a lower high, showing weaker upward momentum. A bullish divergence is when price makes a lower low but MACD makes a higher low. Divergences warn that a trend is tiring but can last a long time before price turns.
What are the best MACD settings?
The standard 12, 26, 9 settings are used by most charting tools and traders. Faster settings such as 5, 35, 5 or 8, 17, 9 react sooner but give more false signals; on weekly charts the standard settings cover a much longer time span.
Can you compare MACD values between stocks?
Not directly. MACD is measured in price units, so a $500 stock has much larger MACD values than a $20 stock. The Percentage Price Oscillator (PPO), which divides the EMA difference by the slower EMA, makes values comparable.