What is the Rate of Change?
ROC answers one question: how much has this stock gained or lost, in percent, over the last n bars? A 9-period ROC of +5 means the close is 5% above the close nine sessions ago. Plotted every day, those readings form an oscillator around zero that shows momentum directly, with no smoothing and no averages.
Two things matter: which side of zero ROC is on (the direction of the move over the period) and which way ROC is heading (whether the move is accelerating or fading). A stock can still be up over nine days while its ROC is falling: the gain is getting smaller.
ROC formula
n = lookback period (9, 12 and 14 are common)
Its close relative, the momentum indicator, is simply Closet − Closet−n in dollars. ROC divides by the old price, which turns the change into a percentage that can be compared across stocks with very different prices.
Worked example: a 9-period ROC
Ten daily closes: $100, $102, $101, $104, $106, $105, $108, $110, $109 and $112. On day 11 the stock closes at $107.
| Day | Close | Close 9 days earlier | ROC (9) |
|---|---|---|---|
| 10 | $112 | $100 (day 1) | 100 × (112 − 100) / 100 = +12.00 |
| 11 | $107 | $102 (day 2) | 100 × (107 − 102) / 102 = +4.90 |
The stock fell 4.5% on day 11, but ROC dropped 7 points. Part of the drop came from the other end of the window: the comparison price moved from $100 to $102. Like the simple moving average’s drop-off effect, ROC depends on the price leaving the window as much as on the price entering it.
Reading ROC on a chart: Lowe’s (LOW)
The daily chart of Lowe’s Companies (LOW) below covers one year. The upper panel shows price with the 10, 50 and 200-day SMAs; the lower panel shows ROC (9), with the zero line dashed and the +10 and −10 levels marked.
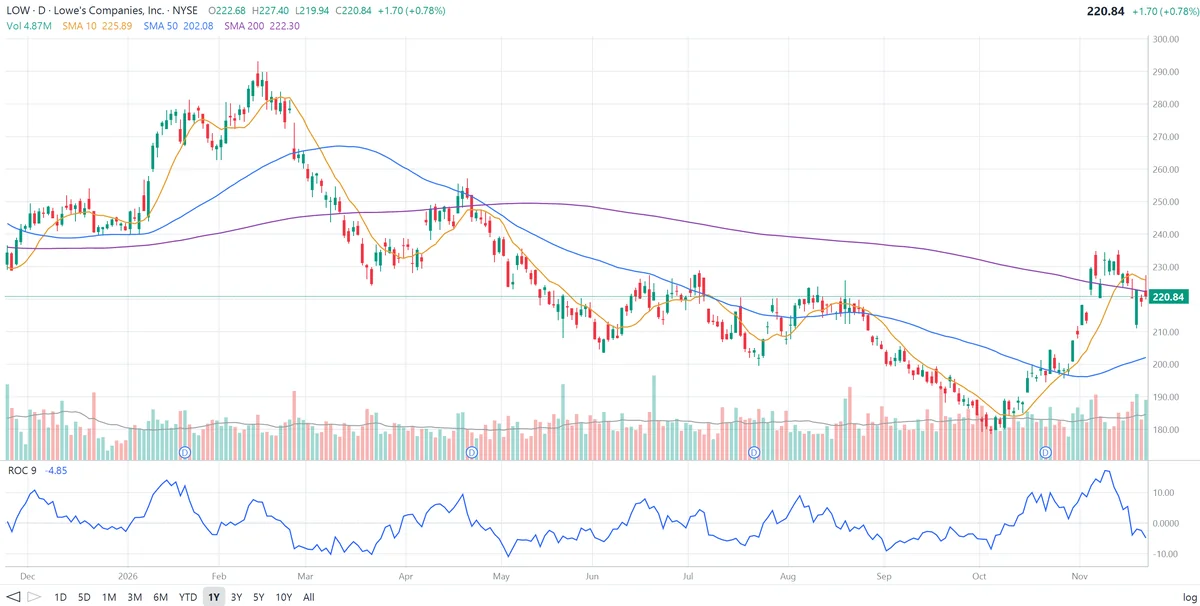
The reading is easy to check: an ROC of −4.85 means the close nine sessions ago was 220.84 / (1 − 0.0485) ≈ $232.10, which matches where Lowe’s traded near its early-November high.
What ROC shows on this chart:
- A bearish divergence at the top. Lowe’s jumped from about $240 to $280 in January, and ROC reached about +14. In mid-February the stock made its high for the year near $293, but ROC peaked at only about +7. Price was higher; the speed of the advance was much lower. In March Lowe’s fell back to about $225, with ROC between −6 and −9 for most of the month.
- The year’s low reading. A late-April slide from about $257 pushed ROC to about −10 in early May, its lowest of the year. ROC then stayed below zero for most of May as the stock drifted down toward $204 by early June.
- Choppy middle. From June to August Lowe’s moved between roughly $200 and $228 and ROC crossed zero again and again, rarely reaching beyond ±7. In a range, zero-line crosses are mostly noise.
- A slow grind lower. From late August to early October ROC stayed negative for about six weeks, between about −3 and −8, while Lowe’s slid from about $222 to $180. No single day was dramatic; ROC captured the steady loss of momentum.
- The autumn rally. ROC crossed above zero in mid-October, near the $180 low, and climbed to about +15 in early November, the highest reading of the year, as Lowe’s rallied to about $235.
- The latest reading. ROC crossed back below zero in mid-November and is −4.85. The stock rose 0.8% on the last bar, but it is still about 5% below where it closed nine sessions ago, so momentum over the window is negative. Price sits just below its 10 and 200-day SMAs and well above the rising 50-day.
How traders use ROC
1. Zero-line crosses
ROC crossing above zero means the stock is now higher than it was n periods ago; crossing below means it is lower. With a short period this is very sensitive, so many traders require a longer period or a trend filter such as a 50 or 200-day moving average.
2. Divergence
A new price high with a lower ROC high (as on Lowe’s in February), or a new price low with a higher ROC low, shows that the move is losing speed. Because ROC is unsmoothed, its divergences tend to show up earlier, and more often, than those of smoothed indicators such as MACD.
3. Extremes relative to the stock’s own history
ROC has no fixed overbought or oversold levels, but each stock has a typical range. On Lowe’s, ROC rarely went beyond ±10 with a 9-day period, so readings near +15 or −10 marked stretched moves.
4. Building block
Several indicators are built from ROC, including the Know Sure Thing (KST), which combines four smoothed ROCs of different lengths, and the Coppock Curve, a weighted average of two long-term ROCs used on monthly charts.
ROC settings
| Period | Use |
|---|---|
| 9 to 14 | Short-term momentum and swing trading; common chart defaults |
| 21 to 25 | About one month of trading days |
| 125 or 250 | About six months or one year; long-term momentum, used for ranking stocks |
The 12-month ROC is the basis of many momentum investing strategies that buy the stocks with the strongest performance over the past year.
Limitations of ROC
- Two-point comparison. ROC looks only at today and one past day, so a single unusual close at either end of the window moves it sharply.
- Noisy with short periods. A 9-period ROC can cross zero many times in a sideways market.
- No fixed levels. Overbought and oversold have to be judged from each stock’s own history.
- Not a prediction. Combine ROC with the trend, support and resistance, volume and fundamentals.
Frequently asked questions
What is the Rate of Change indicator?
The Rate of Change (ROC) is a momentum oscillator that shows the percentage change in price between today’s close and the close n periods ago. It moves above and below a zero line: positive when price is higher than n periods ago, negative when it is lower.
How is ROC calculated?
ROC = (today’s close − close n periods ago) / close n periods ago × 100. With n = 9, a stock at $110 that closed at $100 nine sessions ago has an ROC of +10.
What does a negative ROC mean?
A negative ROC means the price is lower than it was n periods ago. A falling but still positive ROC means price is still up over the period but the gain is shrinking, which is a sign that momentum is fading.
What is the difference between ROC and momentum?
Both compare today’s close with the close n periods ago. The momentum indicator shows the difference in dollars; ROC shows it as a percentage, so ROC readings can be compared across stocks with different prices.
What ROC period should I use?
Common choices are 9, 12 or 14 periods for short-term momentum, 21 to 25 for about a month, and 125 or more for longer-term trends. Shorter periods react faster but are noisier.
Does ROC have overbought and oversold levels?
Not fixed ones. ROC is unbounded, so extreme levels have to be judged from each stock’s own history, for example the highs and lows ROC reached over the past year.