- What it is
- Formula
- Worked example
- Reading the chart
- 10, 50 and 200-day
- Trading signals
- Limitations
- FAQ
What is a simple moving average?
A simple moving average (SMA) takes the closing prices of the last N periods, adds them up and divides by N. “Simple” means every close in the window counts equally. “Moving” means the window slides forward: when a new bar closes, its price joins the average and the oldest price drops out.
The result is a line drawn on top of the price chart. On a daily chart a 50-period SMA is the 50-day moving average; on a weekly chart the same setting covers 50 weeks. Because it averages many prices, the SMA turns slowly and filters out single-day spikes, which makes the direction of the market easier to read than from the candles alone.
SMA formula
For a period of n bars, the simple moving average at bar t is:
Pt = closing price of bar t · n = number of periods (for example 10, 50 or 200)
Charting software doesn’t re-add all n prices on every bar. It updates the previous value by adding the new close and removing the one that left the window:
This form also explains the “drop-off effect”: the SMA can move even on a quiet day if a large price from n bars ago is leaving the window. The first value of an n-period SMA appears only once there are n closes, which is why a 200-day line starts later on a chart than a 10-day line.
Worked example: a 5-day SMA
Take seven daily closes for a sample stock and calculate a 5-day SMA:
| Day | Close | 5-day SMA | Calculation |
|---|---|---|---|
| 1 | $20.00 | – | not enough data |
| 2 | $21.00 | – | not enough data |
| 3 | $22.00 | – | not enough data |
| 4 | $23.00 | – | not enough data |
| 5 | $24.00 | $22.00 | (20 + 21 + 22 + 23 + 24) / 5 = 110 / 5 |
| 6 | $26.00 | $23.20 | (21 + 22 + 23 + 24 + 26) / 5 = 116 / 5 |
| 7 | $25.00 | $24.00 | (22 + 23 + 24 + 26 + 25) / 5 = 120 / 5 |
On day 7 the shortcut gives the same answer: 23.20 + (25 − 21) / 5 = 24.00. Notice that the stock closed lower on day 7 ($25 versus $26), yet the SMA still rose, because the $21 close leaving the window was much lower than the $25 close entering it. The average also sits below the latest price throughout: in a rising market the SMA trails price from underneath, and in a falling market it trails from above.
Reading the SMA on a chart: Cisco (CSCO)
The daily chart of Cisco Systems (CSCO) below shows six months of candles with the three moving averages most traders use: the 10-day SMA (orange), the 50-day SMA (blue) and the 200-day SMA (purple).
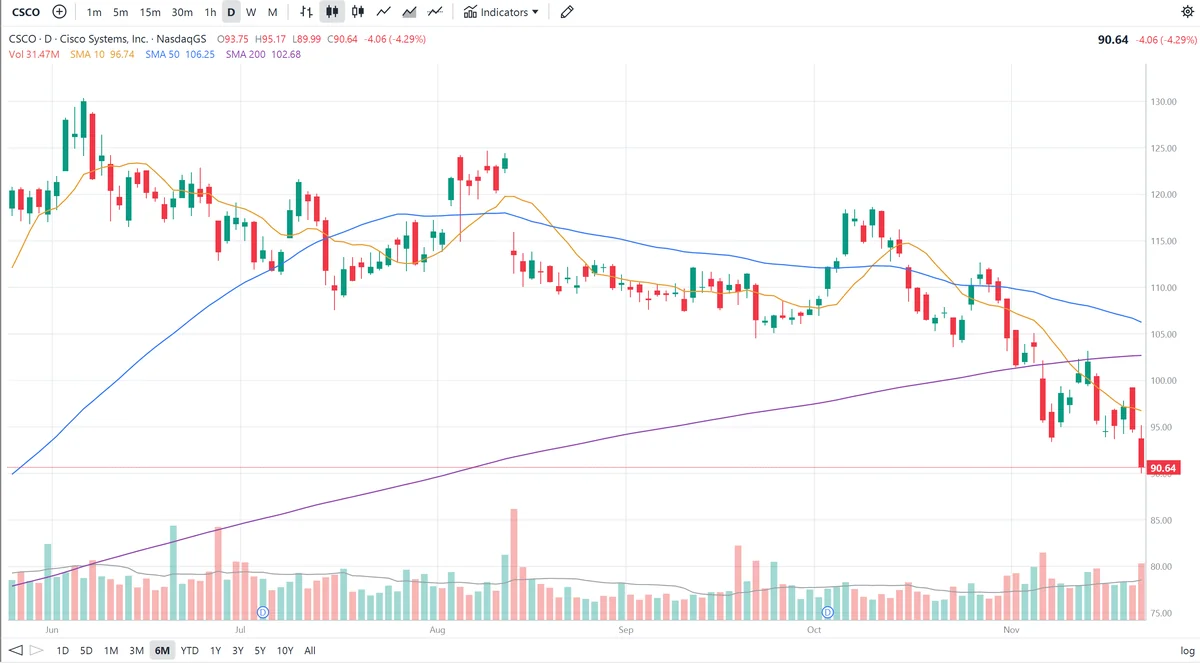
What the three lines say about this chart:
- The 10-day SMA hugs price. It follows every swing within a few days. From June to mid-October it crossed back and forth over the 50-day line as CSCO moved sideways between roughly $105 and $125, which is typical of a short SMA in a range: lots of crossings, few lasting signals.
- The 50-day SMA tracks the medium-term trend. It rose through June and July, flattened near $118 in August, then turned down. Price failed to hold above it in October and November; each rally stalled near the blue line, which acted as resistance.
- The 200-day SMA is the long-term line. It is still rising, slowly, because it reflects the higher prices of the past ten months. In early November CSCO broke below it, and the rebound that followed failed right at the purple line, a classic sign that former support has become resistance.
- Order of the lines. Price is below the 10-day, which is below the 200-day, which is below the 50-day. Price under all three averages, with the short averages falling, describes a correction in progress. The 50-day is still above the 200-day, so there is no death cross yet, but the gap has narrowed to about $3.60 and the 50-day is falling toward a still-rising 200-day.
10, 20, 50 and 200-day SMA: which period to use
The period sets the trade-off between speed and smoothness. Shorter averages react quickly but give more false signals; longer averages are steadier but turn late.
| Period | Covers | Typical use |
|---|---|---|
| 10-day | 2 trading weeks | Short-term momentum; swing traders’ trailing line |
| 20-day | ~1 month | Short-term trend; middle line of Bollinger Bands |
| 50-day | ~10 weeks | Medium-term trend; first support in an uptrend |
| 100-day | ~5 months | Intermediate trend |
| 200-day | ~10 months | Long-term trend; the line that separates long-term uptrends from downtrends |
The 50 and 200-day averages matter partly because so many people watch them: when large funds and the press react at the same levels, those levels tend to hold or break with more force. On weekly charts, the 40-week SMA is roughly the same as the 200-day.
How traders use the SMA
1. Trend direction
The slope of the SMA shows the trend. A rising 200-day SMA with price above it describes a long-term uptrend; a falling 200-day with price below it describes a long-term downtrend. Many long-term investors use “price above the 200-day” as a simple filter before buying a stock.
2. Dynamic support and resistance
In a healthy uptrend, pullbacks often stop near the 20 or 50-day SMA before the trend resumes. In a downtrend, rallies often fail at the same lines, as CSCO did at its 50-day and 200-day SMAs in November.
3. Price crossovers
A close above an SMA after a decline can mark the start of a new up-move, and a close below it the start of a down-move. Traders usually want confirmation, such as a second close beyond the line or higher-than-average volume, because single crossings are often false in sideways markets.
4. Golden cross and death cross
When the 50-day SMA crosses above the 200-day SMA, it is called a golden cross and is read as a bullish long-term signal. When the 50-day crosses below the 200-day, it is a death cross. Both are slow signals that confirm a trend change already under way rather than predict one; by the time they happen, price has usually moved a long way.
5. Distance from the average
Price can’t stay far from its moving average for long. A stock trading 20% or more above its 50-day SMA is often stretched and due for a pause, and one trading far below it, like CSCO at nearly 15% under its 50-day, is often oversold in the short term, even when the trend is down.
SMA vs EMA
The exponential moving average (EMA) gives more weight to the most recent closes, while the SMA weights every close in the window equally. The EMA therefore turns sooner after a change in direction, and the SMA is smoother and less jumpy. Short-term traders often prefer EMAs (for example the 9 or 21-period EMA and the MACD, which is built from EMAs); longer-term investors usually stick with the 50 and 200-day SMAs, which are the standard on most charts and in market commentary.
Limitations of the SMA
- It lags. Every SMA is built from past prices, so it always confirms a move after it starts. The longer the period, the bigger the lag.
- Whipsaws in sideways markets. When price moves in a range, it crosses the average again and again, producing buy and sell signals that go nowhere.
- Equal weighting. A close from 199 days ago counts as much as yesterday’s in a 200-day SMA, which may not reflect current conditions.
- Drop-off effect. The line can move because an old price is leaving the window, not because anything happened today.
- No prediction. An SMA describes where price has been. Combine it with volume, price action and other indicators, and with the company’s fundamentals, rather than trading on it alone.
Frequently asked questions
What is a simple moving average?
A simple moving average (SMA) is the plain average of the last N closing prices. Each new bar adds the newest close and drops the oldest, so the line moves along with price and smooths out day-to-day noise.
How do you calculate an SMA?
Add the closing prices of the last N periods and divide by N. For a 5-day SMA with closes of 20, 21, 22, 23 and 24, the SMA is 110 / 5 = 22.
What is the difference between the 50-day and 200-day SMA?
The 50-day SMA follows the medium-term trend and reacts within weeks. The 200-day SMA covers about ten months of trading and is the standard line for the long-term trend; many investors treat a stock above its 200-day SMA as being in a long-term uptrend.
What are a golden cross and a death cross?
A golden cross happens when the 50-day SMA crosses above the 200-day SMA and is read as a bullish long-term signal. A death cross is the opposite: the 50-day SMA crosses below the 200-day SMA.
Is the SMA or the EMA better?
Neither is better in every case. The SMA weights every close equally, so it is smoother and gives fewer false signals but reacts later. The EMA weights recent closes more, so it turns faster but whipsaws more in sideways markets.
Which SMA period should I use?
Common choices are 10 or 20 periods for the short-term trend, 50 for the medium-term trend and 200 for the long-term trend. Shorter periods react faster but are noisier; longer periods are smoother but lag more.