- What it is
- Formula
- Worked example
- Lag vs SMA and EMA
- Reading the chart
- Trading signals
- Limitations
- FAQ
What is a weighted moving average?
Every moving average smooths a series of closing prices into a line that shows the trend. What sets them apart is how much each close counts. In a weighted moving average (also called a linearly weighted moving average, LWMA) the weights form a simple countdown. In a 20-period WMA the latest close has weight 20, the one before it 19, and so on down to the close 20 bars ago, which has weight 1. Anything older has weight 0.
Because the newest prices dominate, the WMA turns quickly when the trend changes, and because the weights stop at N, a large price from long ago can’t keep pulling on the line the way it does, a little, in an EMA.
WMA formula
For a period of n bars, the weighted moving average at bar t is:
Pt = closing price of bar t · n = number of periods · the denominator is the sum of the weights 1 + 2 + … + n
For a 20-period WMA the weights add up to 20 × 21 / 2 = 210, so the newest close carries 20 / 210 = 9.5% of the total and the oldest 1 / 210 = 0.5%. In general the newest close gets 2 / (n + 1) of the weight, exactly the same share as in an EMA of the same period; the difference is how quickly the weights fall away behind it.
| Bars ago | SMA(20) weight | EMA(20) weight | WMA(20) weight |
|---|---|---|---|
| 0 (today) | 5.0% | 9.5% | 9.5% |
| 5 | 5.0% | 5.8% | 7.1% |
| 10 | 5.0% | 3.5% | 4.8% |
| 15 | 5.0% | 2.1% | 2.4% |
| 19 | 5.0% | 1.4% | 0.5% |
| 20 and older | 0% | 13.5% in total | 0% |
Worked example: a 5-day WMA
Using the same seven closes as the SMA and EMA pages, a 5-day WMA uses weights 1, 2, 3, 4 and 5, which add up to 15:
| Day | Close | 5-day WMA | 5-day SMA | 5-day EMA | WMA calculation |
|---|---|---|---|---|---|
| 1–4 | $20 – $23 | – | – | – | not enough data |
| 5 | $24.00 | $22.67 | $22.00 | $22.00 | (1·20 + 2·21 + 3·22 + 4·23 + 5·24) / 15 = 340 / 15 |
| 6 | $26.00 | $24.00 | $23.20 | $23.33 | (1·21 + 2·22 + 3·23 + 4·24 + 5·26) / 15 = 360 / 15 |
| 7 | $25.00 | $24.60 | $24.00 | $23.89 | (1·22 + 2·23 + 3·24 + 4·26 + 5·25) / 15 = 369 / 15 |
On every day the WMA sits closest to the latest price. On day 5, after four days of rising prices, the WMA is already at $22.67 while the SMA is at $22.00: the higher recent closes carry more weight. When the stock slips from $26 to $25 on day 7, the WMA still rises, to $24.60, because the $26 close now sits in the heavily weighted second slot and the low $21 close has left the window.
How much does a WMA lag? WMA vs SMA vs EMA
The clearest way to compare moving averages is to feed them a stock that rises by the same amount every day. In that steady trend each average settles a fixed number of bars behind price:
| Average | Lag in a steady trend | Period 9 | Period 20 | Period 50 |
|---|---|---|---|---|
| SMA | (n − 1) / 2 bars | 4.0 | 9.5 | 24.5 |
| EMA | (n − 1) / 2 bars | 4.0 | 9.5 | 24.5 |
| WMA | (n − 1) / 3 bars | 2.7 | 6.3 | 16.3 |
In a steady trend the WMA lags about a third less than an SMA or EMA of the same period. The EMA’s advantage over the SMA shows up elsewhere: right after a turn, and in the absence of a drop-off effect. In practice, a 20-period WMA tracks price about as tightly as a 14-period EMA, which is why traders who want a fast line without going to very short periods often pick the WMA.
Reading the WMA on a chart: Intel (INTC)
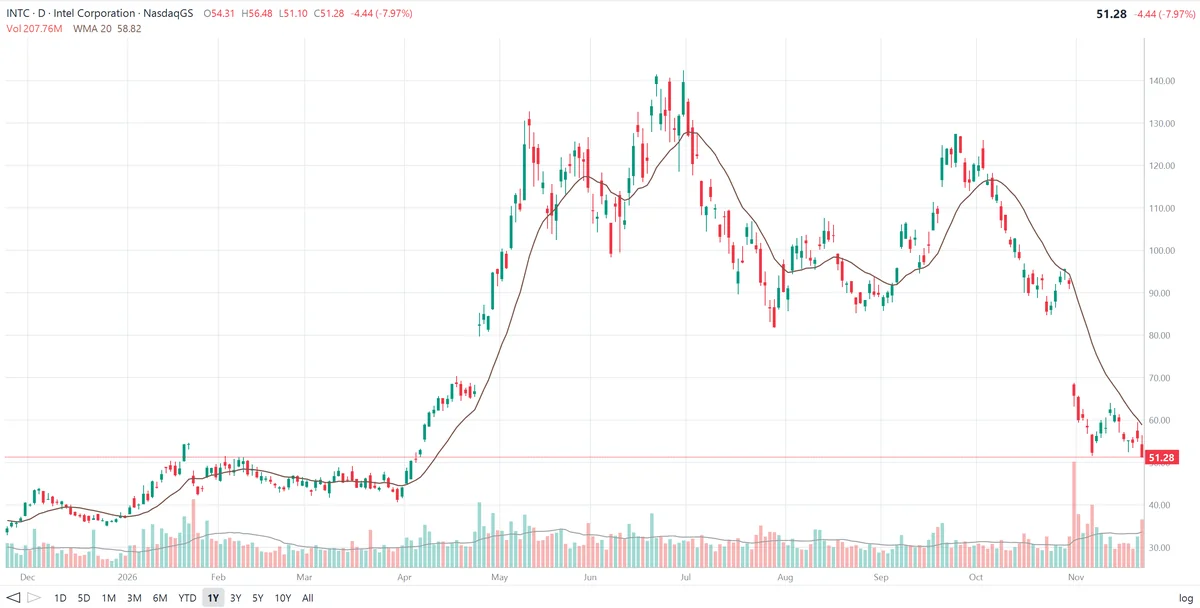
The daily chart of Intel (INTC) below covers one year with a 20-period WMA (brown line), about one month of trading days.
What the line says about this chart:
- Flat WMA, no trend. From December through March INTC moved sideways between roughly $35 and $55. The WMA flattened out and price crossed it again and again, which is what a moving average looks like when there is no trend to follow.
- A breakout the WMA followed closely. In early April price jumped above the flat WMA and the line turned sharply up. Through the rally from about $45 to $130 in early May, every candle stayed above the WMA. In a trend that steep, an SMA of the same length would have trailed much further behind.
- Pullbacks to the line. In late May and June, dips toward $100 briefly took price below the WMA, but the line itself kept rising and acted as support on a closing basis; the stock went on to its high near $140 at the start of July.
- Crossing below and turning down. In July price closed below the WMA and the line rolled over, the first sign that the up-move was over. The decline ran to about $82 in early August.
- Two more swings. August and early September were a range around a flat WMA in the mid-$90s. A rally above the line took INTC to about $127 in early October; price fell back below it in mid-October, and the WMA turned down again.
- A gap the line can’t keep up with. In early November INTC gapped from the low $90s into the $60s on the heaviest volume of the year. Price now sits about 13% below a steeply falling WMA, and each small bounce since has stopped below the line, which now acts as resistance.
How traders use the WMA
1. Trend direction
A rising WMA with price above it describes an uptrend, and a falling WMA with price below it a downtrend. Because the WMA turns faster than an SMA, a change in its slope is an early hint that the trend is changing.
2. Price crossovers
A close above the WMA after a decline can signal the start of an up-move, and a close below it the start of a down-move. As with all fast averages, crossovers work best when price is trending and fail often in sideways markets, like INTC’s December–March range.
3. Two-WMA crossovers
Some traders run a fast and a slow WMA, for example 10 and 30, and treat the fast line crossing above the slow one as a buy signal and crossing below as a sell signal, the same way the 9/21 EMA pair is used.
4. Pullback support and trailing exits
In a strong trend, pullbacks often stop near the 20-period WMA. Traders use the first test of the line as an entry and a close beyond it as an exit.
5. Hull Moving Average
The Hull Moving Average combines a half-length WMA, a full-length WMA and a final WMA of length √n to cut lag almost to zero while staying smooth. If your charting tool offers HMA, it is built on the weighting described on this page.
Limitations of the WMA
- Still a lagging indicator. The WMA lags less than an SMA, but it is built from past prices and always confirms a move after it starts.
- More false signals. Its speed means more crossovers in choppy markets, and each one has a cost.
- Less common. Most market commentary refers to SMAs and EMAs, so WMA levels attract less collective attention as support and resistance.
- Sharp cut-off. A big price enters the WMA with the highest weight and leaves it completely N bars later, which can make the line step at the edges.
- No prediction. The WMA describes where price has been. Confirm its signals with volume, price action, other indicators and the company’s fundamentals.
Frequently asked questions
What is a weighted moving average?
A weighted moving average (WMA) averages the last N closes but gives each one a weight that grows in a straight line: the oldest close gets weight 1, the next 2, and the newest gets weight N. Recent prices therefore count the most, and prices older than N bars count not at all.
How do you calculate a WMA?
Multiply each of the last N closes by its weight (N for the newest, 1 for the oldest), add the products and divide by the sum of the weights, N × (N + 1) / 2. For a 5-day WMA of 20, 21, 22, 23 and 24 the result is 340 / 15 = 22.67.
What is the difference between WMA, EMA and SMA?
The SMA weights every close in its window equally. The EMA weights recent closes more, with weights that shrink geometrically and never quite reach zero. The WMA weights recent closes more with weights that fall in a straight line and stop completely after N bars. In a steady trend, a WMA lags price by about (N − 1) / 3 bars, versus (N − 1) / 2 bars for an SMA or EMA of the same length.
Is a WMA faster than an EMA?
For the same period, usually yes. Both give the newest close the same weight, 2 / (N + 1), but the WMA drops older prices completely after N bars, so in a steady trend it sits closer to price than the EMA.
What is a 20-period WMA used for?
The 20-period WMA covers about one month of daily bars and is used to follow the short-term trend, to spot when price crosses the average, and as a trailing level that pullbacks often hold in a strong trend.
Which indicators are built from the WMA?
The best known is the Hull Moving Average, which combines WMAs of different lengths to reduce lag further. Some versions of the Coppock Curve and other oscillators also use a WMA for smoothing.