- What it is
- Formula
- Worked example
- Reading the chart
- Popular periods
- Trading signals
- EMA vs SMA
- Limitations
- FAQ
What is an exponential moving average?
Like any moving average, the EMA smooths a series of closing prices into a single line that shows the direction of the trend. The difference is in the weighting. A simple moving average counts every close in its window equally; an exponential moving average gives the newest close the largest weight, the one before it a little less, and so on, with the weights shrinking by the same factor at every step.
The result is a line that hugs price more closely. When a stock changes direction, a 21-period EMA starts to turn within a few bars, while a 21-period SMA keeps going the old way until enough old prices have dropped out of its window.
EMA formula
Every EMA value is built from today’s close and yesterday’s EMA, using a smoothing factor α (alpha) that depends on the period n:
Pt = closing price of bar t · n = number of periods (for example 9 or 21) · α = smoothing factor
The same formula is often written in a form that is easier to read: the EMA moves a fixed fraction α of the way from its previous value toward today’s price.
There is no earlier EMA for the very first bar, so the calculation is usually seeded with the simple moving average of the first n closes. Charting packages differ slightly in how they seed, so EMA values from two sources can differ by a few cents early in a chart; the difference fades away after a few dozen bars.
| Period n | Smoothing factor α | Weight on today’s close | Weight on the last n bars |
|---|---|---|---|
| 9 | 2 / 10 = 0.200 | 20.0% | 86.6% |
| 12 | 2 / 13 = 0.154 | 15.4% | 86.5% |
| 21 | 2 / 22 = 0.091 | 9.1% | 86.5% |
| 26 | 2 / 27 = 0.074 | 7.4% | 86.5% |
| 50 | 2 / 51 = 0.039 | 3.9% | 86.5% |
| 200 | 2 / 201 = 0.010 | 1.0% | 86.5% |
The last column shows a useful property: whatever the period, about 86% of an EMA’s weight sits on the latest n bars and about 14% on everything older. So an “n-period” EMA really is mostly about the last n bars, even though, in theory, it never fully forgets any price.
Worked example: a 5-day EMA
Take the same seven closes used on the SMA page and calculate a 5-day EMA. With n = 5 the smoothing factor is α = 2 / 6 = 1/3, so each day the EMA moves one third of the way toward the close.
| Day | Close | 5-day EMA | 5-day SMA | EMA calculation |
|---|---|---|---|---|
| 1–4 | $20 – $23 | – | – | not enough data |
| 5 | $24.00 | $22.00 | $22.00 | seed: SMA of days 1–5 = 110 / 5 |
| 6 | $26.00 | $23.33 | $23.20 | 22.00 + (26 − 22.00) / 3 |
| 7 | $25.00 | $23.89 | $24.00 | 23.33 + (25 − 23.33) / 3 |
On day 6 the $26 jump pulls the EMA up to $23.33, more than the SMA’s $23.20: the newest close counts for a third of the EMA but only a fifth of the SMA. On day 7 the order flips. The SMA jumps to $24.00 only because the low $21 close drops out of its window, while the EMA, which has no window to drop out of, simply moves a third of the way from $23.33 toward $25. That is the EMA’s other advantage: it changes because of today’s price, not because of a price from n days ago.
Reading the EMA on a chart: Clorox (CLX)
The daily chart of The Clorox Company (CLX) below covers one year with the 9-period EMA (green) and the 21-period EMA (red), a pair widely used by swing traders.
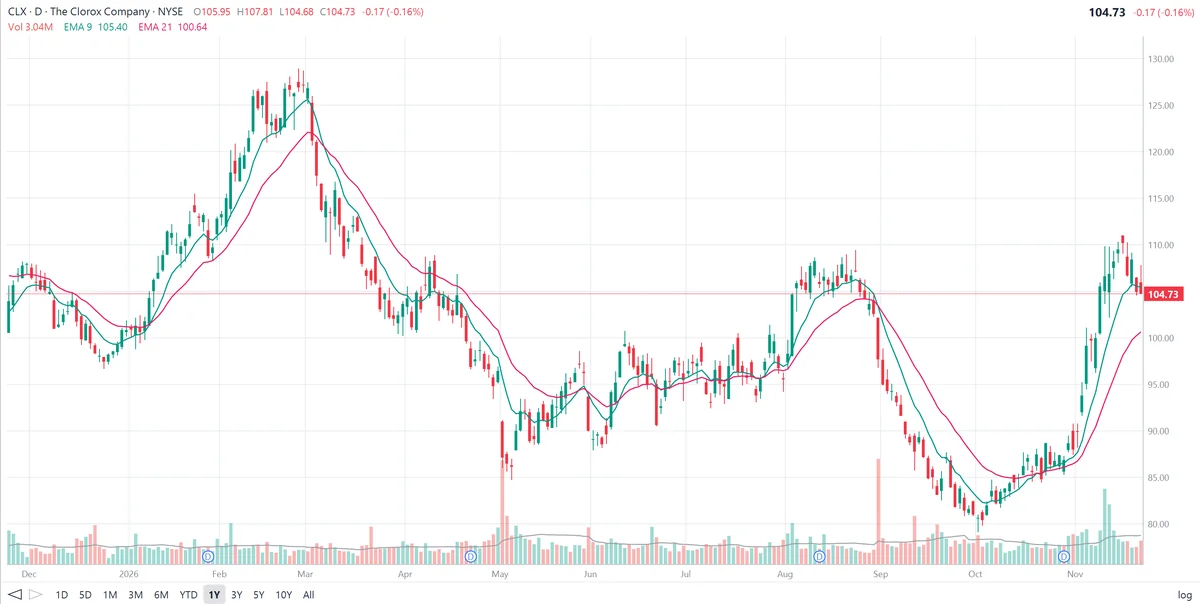
What the two lines say about this chart:
- Trending phases: the 9 stays on the right side of the 21. In the January–February rally from about $97 to nearly $128, the green 9-EMA stayed above the red 21-EMA the whole way and dips stopped at or near the lines. In the March–May decline back toward $86 the order reversed, and every bounce stalled at the 21-EMA, which acted as resistance.
- Crossovers mark the turns. The 9 crossed below the 21 in early March, a few days after the top, and crossed back above it in mid-October near the $82–$85 low. Both crossings came late compared with the exact turning point, but early compared with an SMA of the same length.
- Sideways phases: the lines tangle. From June through July CLX moved in a range between roughly $90 and $100. The two EMAs flattened, ran close together and crossed several times without a lasting move in either direction, the classic whipsaw zone where crossover signals don’t work.
- Gaps outrun the EMA. The sharp drops in early May and early September came on volume spikes and opened a wide gap between price and both lines; the EMAs needed days to catch up. No moving average can warn of a gap.
- At the right edge of the chart. After a fast November rally to about $110, CLX has pulled back to its 9-EMA ($105.40) while staying well above a still-rising 21-EMA ($100.64). The 9 is above the 21, so the short-term trend is up; a close below the 21-EMA would be the first sign that the rally has failed.
Popular EMA periods
| Periods | Horizon | Typical use |
|---|---|---|
| 8, 9 or 10 | Very short term | Fast signal line; trailing stop for strong trends |
| 9 and 21 | Short term | Swing-trading crossover pair, as on the CLX chart |
| 12 and 26 | Short to medium | The two EMAs inside MACD; MACD’s signal line is a 9-period EMA of their difference |
| 20 | ~1 month | Short-term trend and pullback level; middle of Keltner Channels |
| 50 | Medium term | Intermediate trend |
| 200 | Long term | Long-term trend; a faster alternative to the 200-day SMA |
On intraday charts the same numbers apply to bars, not days: a 9-period EMA on a 5-minute chart covers the last 45 minutes or so.
How traders use the EMA
1. Trend direction and slope
A rising EMA with price above it describes an uptrend; a falling EMA with price below it describes a downtrend. Because the EMA turns quickly, its slope is often the first visible sign that momentum is changing.
2. Fast/slow crossovers
A cross of the faster EMA above the slower one (9 over 21, or 12 over 26) signals that short-term momentum has turned up; a cross below signals it has turned down. Crossovers work best in trending markets and should be filtered, for example by taking only long signals while price is above the 50 or 200-day average.
3. Pullback entries
In a strong trend, pullbacks often find support at the 9, 20 or 21-period EMA. Traders who missed the breakout use the first test of the EMA as a lower-risk entry, with a stop just beyond the line.
4. Trailing stop
Because it follows price closely, a short EMA works as a trailing exit: hold while closes stay above the 9 or 21-EMA, exit on the first close below. The shorter the EMA, the tighter the stop.
5. Building block for other indicators
Many indicators are made from EMAs: MACD (12 and 26-period EMAs plus a 9-period signal line), the Keltner Channels midline, the smoothing inside the RSI and ADX calculations, and the TRIX and PPO oscillators. Understanding the EMA makes all of them easier to read.
EMA vs SMA
| EMA | SMA | |
|---|---|---|
| Weighting | Newest close weighs most; weights shrink geometrically | Every close in the window counts equally |
| Speed | Turns sooner after a change in trend | Turns later; smoother line |
| False signals | More whipsaws in sideways markets | Fewer whipsaws, but later entries and exits |
| Drop-off effect | None: moves only on today’s close | Can move when an old price leaves the window |
| Most used for | Short-term trading, MACD, 9/21 and 12/26 pairs | Long-term trend, 50 and 200-day averages |
Many traders combine both: short EMAs for timing, and the 50 and 200-day SMAs for the big picture.
Limitations of the EMA
- It still lags. The EMA reacts faster than the SMA, but it is still built from past prices and always confirms a move after it starts.
- More whipsaws. The speed that helps in trends hurts in ranges: in sideways markets, short EMAs cross price and each other again and again.
- Sensitive to single bars. One unusually large candle moves a short EMA a long way, which can trigger a signal that the next day reverses.
- Values depend on the start. Because each value includes all earlier ones, the EMA depends slightly on where the calculation began and how it was seeded.
- No prediction. An EMA describes where price has been. Confirm its signals with volume, price action and other indicators, and with the company’s fundamentals.
Frequently asked questions
What is an exponential moving average?
An exponential moving average (EMA) is a moving average that gives the most weight to the latest price and progressively less to older prices. It turns faster than a simple moving average of the same length, so it shows changes in trend sooner.
How do you calculate an EMA?
First compute the smoothing factor α = 2 / (n + 1). Then each new EMA = previous EMA + α × (today’s close − previous EMA). The first EMA is usually seeded with the simple moving average of the first n closes.
What does a 9 and 21 EMA crossover mean?
When the faster 9-period EMA crosses above the slower 21-period EMA, short-term momentum has turned up and many swing traders read it as a buy signal. A cross below is read as a sell signal. The signal works best in trending markets and gives many false signals when price moves sideways.
Is the EMA better than the SMA?
Neither is better in every case. The EMA reacts faster and suits short-term trading, but it whipsaws more in sideways markets. The SMA is smoother and is the standard for the long-term 50 and 200-day averages.
Which EMA periods are most popular?
The 9 and 21-period EMAs are popular with swing traders, the 12 and 26-period EMAs are the basis of MACD, and the 50 and 200-day EMAs are used for the medium and long-term trend.
Does the EMA use all past prices?
In principle yes, because each EMA value includes the previous one, but the weights shrink quickly. For any period n, roughly 86% of the total weight falls on the most recent n bars, so very old prices have almost no effect.