What is the Average Directional Index?
J. Welles Wilder introduced the ADX in 1978, in the same book as RSI, the Average True Range and the Parabolic SAR. His idea was to split the question “is there a trend?” from “which way is it going?”. The DMI answers both with three lines:
- +DIPlus Directional IndicatorHow much of the recent trading range came from moves to new highs. Rises when buyers push price up.
- −DIMinus Directional IndicatorHow much of the recent range came from moves to new lows. Rises when sellers push price down.
- ADXAverage Directional IndexA smoothed measure of how far apart +DI and −DI are. High when one side clearly dominates, low when they are balanced.
The key point: ADX has no direction. A stock falling hard and a stock rising hard can both have an ADX of 40. Direction comes from comparing +DI with −DI.
ADX formula
The calculation runs in four steps. All smoothing uses Wilder’s method over 14 periods, which works like an EMA with smoothing factor 1/14.
Step 1: directional movement and true range
+DM = up move if it is larger than the down move and above zero, otherwise 0 · −DM = down move if it is larger than the up move and above zero, otherwise 0
Step 2: smooth over 14 periods
applied separately to TR, +DM and −DM; the first value is the plain sum of the first 14 days
Step 3: the directional indicators
Step 4: DX and ADX
H, L, C = high, low, close · the first ADX is the average of the first 14 DX values
A chart setting such as “DMI 14, 14” gives the two periods: 14 for smoothing +DM, −DM and TR, and 14 for averaging DX into ADX. Because ADX is an average of an average, it needs a long warm-up (about 2 × 14 bars before it means anything) and it turns slowly.
Worked example: one day of ADX
Yesterday a stock traded between $48.50 and $50.00 and closed at $49.60. Today it traded between $48.20 and $50.40 and closed at $48.40. Assume yesterday’s smoothed values were TR14 = 28.00, +DM14 = 7.00, −DM14 = 5.60 and ADX = 20.00.
| Step | Value | Calculation |
|---|---|---|
| Up move / down move | 0.40 / 0.30 | 50.40 − 50.00 / 48.50 − 48.20 |
| +DM / −DM | 0.40 / 0 | up move is larger, so only +DM counts |
| True range | 2.20 | max(50.40 − 48.20, |50.40 − 49.60|, |48.20 − 49.60|) |
| TR14 | 28.20 | 28.00 − 28.00/14 + 2.20 |
| +DM14 / −DM14 | 6.90 / 5.20 | 7.00 − 0.50 + 0.40 / 5.60 − 0.40 + 0 |
| +DI / −DI | 24.47 / 18.44 | 100 × 6.90 / 28.20 / 100 × 5.20 / 28.20 |
| DX | 14.05 | 100 × 6.03 / 42.91 |
| ADX | 19.57 | (13 × 20.00 + 14.05) / 14 |
Note what happened: the stock closed $1.20 lower, yet +DM won because its high went further above yesterday’s high than its low went below yesterday’s low. Directional movement looks at the range, not the close. And because +DI and −DI are fairly close, DX is low and ADX edges down from 20.00 to 19.57: no strong trend either way.
What ADX levels mean
| ADX | Trend strength | What it usually means |
|---|---|---|
| Below 20 | Weak or none | Sideways market; moving average and breakout signals often fail; range trading works better |
| 20 – 25 | Emerging | A trend may be starting, especially if ADX is rising |
| 25 – 40 | Strong | Trend-following signals work best; pullbacks tend to be bought (or rallies sold) |
| 40 – 50 | Very strong | Mature trend; watch for ADX to turn down as a sign the move is tiring |
| Above 50 | Extreme | Rare; often near the climax of a sharp move |
The slope of ADX matters as much as its level. A rising ADX means the trend is getting stronger, whatever its direction; a falling ADX means it is weakening, even while price keeps moving the same way.
Reading ADX on a chart: Microsoft (MSFT)
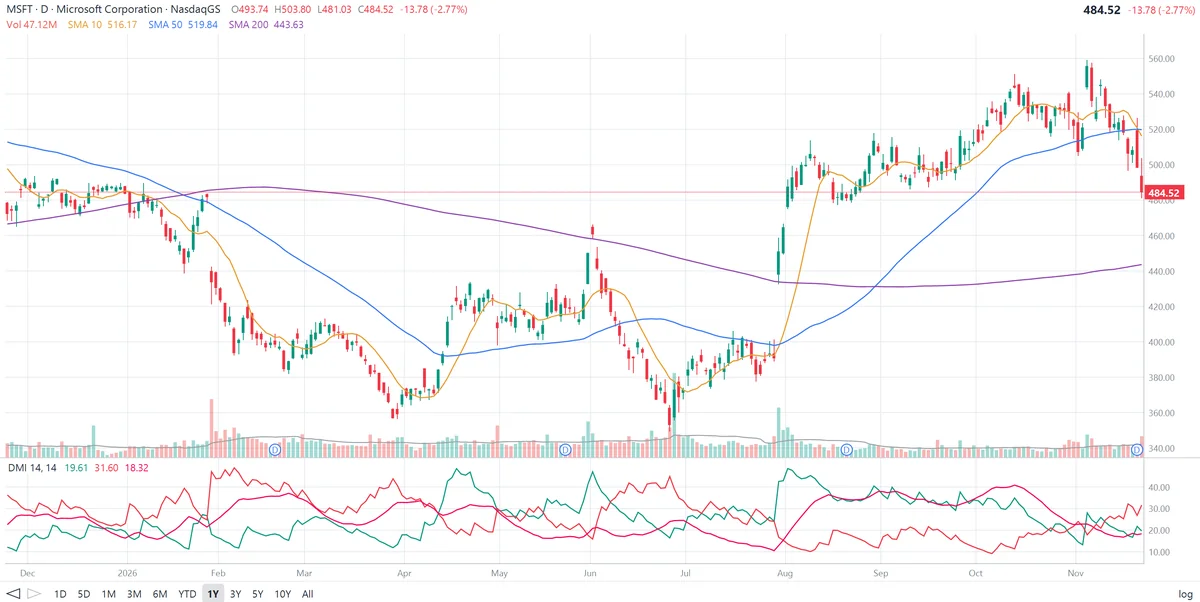
The daily chart of Microsoft (MSFT) below covers one year. The upper panel shows price with the 10, 50 and 200-day SMAs; the lower panel shows DMI(14, 14): +DI in green, −DI in red and ADX in deeper crimson, the smoothest of the three lines.
What the DMI shows on this chart:
- A strong downtrend. From late January MSFT fell from about $485 to below $400 by late February. −DI jumped above 40 while +DI stayed under 20, and ADX climbed from the mid-20s to about 37: sellers clearly in control, and a trend strong enough to follow.
- Strength fading near the low. In March the decline slowed. ADX fell back into the low 20s even as price drifted lower, then picked up again as MSFT made its low near $360 at the end of March.
- A DI crossover at the turn. In early April +DI crossed above −DI and spiked near 50 as MSFT rallied toward $430. ADX stayed around 30, but then sank to the mid-teens in May as price moved sideways between about $405 and $430.
- A weak-trend decline. In June MSFT fell from about $465 to around $360, and −DI crossed back above +DI, but ADX never rose much above 25. The move was sharp but choppy, with rallies along the way.
- The lowest ADX of the year came just before the biggest move. In July the two DI lines tangled and ADX sank to about 11 while MSFT sat in a $380–$405 range. At the end of July the stock gapped up toward $470 and kept rising. +DI jumped near 48, −DI fell near 10, and ADX climbed from 11 to the mid-30s within weeks, a textbook case of a very low ADX preceding a breakout.
- A long, strong uptrend. From August to mid-October ADX held between about 32 and 41 while +DI stayed well above −DI and MSFT climbed to about $545. ADX peaked near 41 in mid-October and then turned down, a sign the trend was losing strength even though price went on to a new high near $558 in early November.
- The latest reading. In November −DI crossed above +DI as MSFT fell back below its 10 and 50-day SMAs (−6.1% and −6.8%), though it is still 9% above the 200-day. −DI is 31.60 and +DI 19.61, so sellers have the upper hand, but ADX is only 18.32: the decline is not yet a strong trend. Today’s DX is about 23, above the ADX, so ADX is turning up; a move above 20–25 would confirm that a downtrend is taking hold.
How traders use ADX
1. Trend filter
The most common use: apply trend-following tools (moving average crossovers, breakouts, MACD signals) only when ADX is above 20 or 25, and switch to range tactics, buying near support and selling near resistance, when it is below 20.
2. DI crossovers
+DI crossing above −DI is a buy signal; −DI crossing above +DI is a sell signal. Wilder suggested taking them only when ADX is high enough to confirm a trend, otherwise they whipsaw, as MSFT’s DI lines did in July.
3. Rising vs falling ADX
A rising ADX above 25 says the trend is gaining strength; stay with it. An ADX that turns down from above 40 says the trend is maturing, a reason to tighten stops rather than add to a position.
4. Low ADX as a setup
Very low ADX readings (around 10 to 15) mean the market is coiling. That says nothing about direction, but it often comes before a large move, as on MSFT at the end of July. Traders watch for a breakout with ADX starting to rise.
Limitations of ADX
- Slow. ADX is a smoothed average of an already smoothed ratio, so it often confirms a trend weeks after it starts.
- No direction. ADX alone can’t tell an uptrend from a downtrend; you always need +DI/−DI or price itself.
- Gaps and spikes. One huge bar inflates the true range and directional movement for 14 days.
- Thresholds vary. 20 and 25 are conventions; quiet stocks rarely reach 40, volatile ones often do.
- Not a prediction. ADX describes the trend that has formed. Combine it with price action, volume and the company’s fundamentals.
Frequently asked questions
What is the Average Directional Index (ADX)?
The ADX is an indicator developed by J. Welles Wilder that measures how strong a trend is on a scale from 0 to 100, without saying which way the trend runs. It is plotted with two directional lines, +DI and −DI, which show whether buyers or sellers are in control.
What is a good ADX value?
Readings below 20 suggest a weak trend or a sideways market, 20 to 25 a trend that may be forming, 25 to 40 a strong trend and above 40 a very strong one. Readings above 50 are rare and often come near the end of a big move.
Does a high ADX mean the stock is going up?
No. ADX measures trend strength only. A high ADX can come with a strong downtrend as easily as with a strong uptrend. The direction comes from +DI and −DI: +DI above −DI points to an uptrend, −DI above +DI to a downtrend.
How is ADX calculated?
Each day, compute the upward move (+DM), downward move (−DM) and true range. Smooth all three over 14 periods, then +DI = 100 × smoothed +DM / smoothed TR and −DI = 100 × smoothed −DM / smoothed TR. DX = 100 × |+DI − −DI| / (+DI + −DI), and ADX is the 14-period Wilder average of DX.
What is the difference between ADX and DMI?
DMI, the Directional Movement Index, is the full system: the +DI and −DI lines plus the ADX line. ADX is the single trend-strength line within it. Many charting tools label the whole panel DMI and show the three values together.
What does DMI 14, 14 mean?
The first 14 is the period used to smooth the directional movement and true range for +DI and −DI; the second 14 is the period used to average DX into the ADX line. 14 and 14 are Wilder’s original settings.