- What it is
- Formula
- Worked example
- Settings
- Reading the chart
- Trading signals
- Supertrend vs SAR
- Limitations
- FAQ
What is the Supertrend indicator?
Supertrend, usually credited to French trader Olivier Seban, is a newer indicator than most on this site, but it has become a default on almost every charting platform. It builds two bands around price using the Average True Range (ATR), a measure of how much a stock typically moves in a day, and shows only one of them at a time:
- ▲Green line below priceUptrend. The line is the lower band and can only move up. It is the trailing stop for a long position.
- ▼Red line above priceDowntrend. The line is the upper band and can only move down. It is the stop for a short position.
- ⇅FlipA close through the line switches it to the other band, on the other side of price.
Because the distance from price is a multiple of ATR, the line automatically sits further away on volatile stocks and closer on quiet ones.
Supertrend formula
Start with the midpoint of each bar and the Average True Range over n periods (true range is defined on the ADX page):
H, L = bar high and low · ATRn = average true range over n periods (default 10) · m = multiplier (default 3)
The bands are then “ratcheted” so they only move in the trend’s favor:
- Final lower band: the new lower band, unless it is below yesterday’s final lower band while yesterday’s close was above it. In that case yesterday’s value is kept. So in an uptrend the line can rise or stay flat, never fall.
- Final upper band: the new upper band, unless it is above yesterday’s final upper band while yesterday’s close was below it. In that case yesterday’s value is kept. So in a downtrend the line can fall or stay flat, never rise.
- Which band is shown: in an uptrend Supertrend is the final lower band, until a close below it; then it switches to the final upper band and the trend is down, until a close above that.
Worked example: Supertrend(10, 3) and a flip
A stock is in an uptrend and yesterday’s Supertrend (final lower band) was $46.00. Here are the next three days:
| Day | High / Low / Close | ATR10 | Basic lower band | Supertrend |
|---|---|---|---|---|
| 1 | $52 / $49 / $51.00 | 1.40 | 50.50 − 3 × 1.40 = 46.30 | $46.30 (higher than $46.00, so it moves up) |
| 2 | $51 / $47 / $47.50 | 1.50 | 49.00 − 3 × 1.50 = 44.50 | $46.30 (new band is lower, so the line stays) |
| 3 | $48 / $45 / $45.80 | 1.60 | 46.50 − 3 × 1.60 = 41.70 | close $45.80 is below $46.30: flip to the upper band, 46.50 + 3 × 1.60 = $51.30 |
On day 2 the stock fell $3.50, and the basic lower band dropped to $44.50, but the Supertrend line stayed at $46.30: in an uptrend it never moves down. On day 3 the close broke the line, so the trend flips. The line jumps above price to the upper band at $51.30 and turns red.
Settings
| ATR period, multiplier | Effect |
|---|---|
| 10, 3 (standard) | The common default, written Supertrend(10, 3); a balance between staying in a trend and reacting to a reversal |
| 10, 2 or 7, 2 | Line hugs price; earlier exits, more flips. Popular for short-term trading |
| 14, 4 or 20, 5 | Line far from price; fewer, later flips. For holding long trends |
The multiplier has the bigger effect: it sets how many “average days” of movement price must travel against the trend before the line flips.
Reading Supertrend on a chart: IREN Limited (IREN)
The daily chart of IREN Limited (IREN) below covers one year with Supertrend(10, 3): green below price in uptrends, red above price in downtrends. IREN is a very volatile stock, which makes the line’s ATR-based distance easy to see.
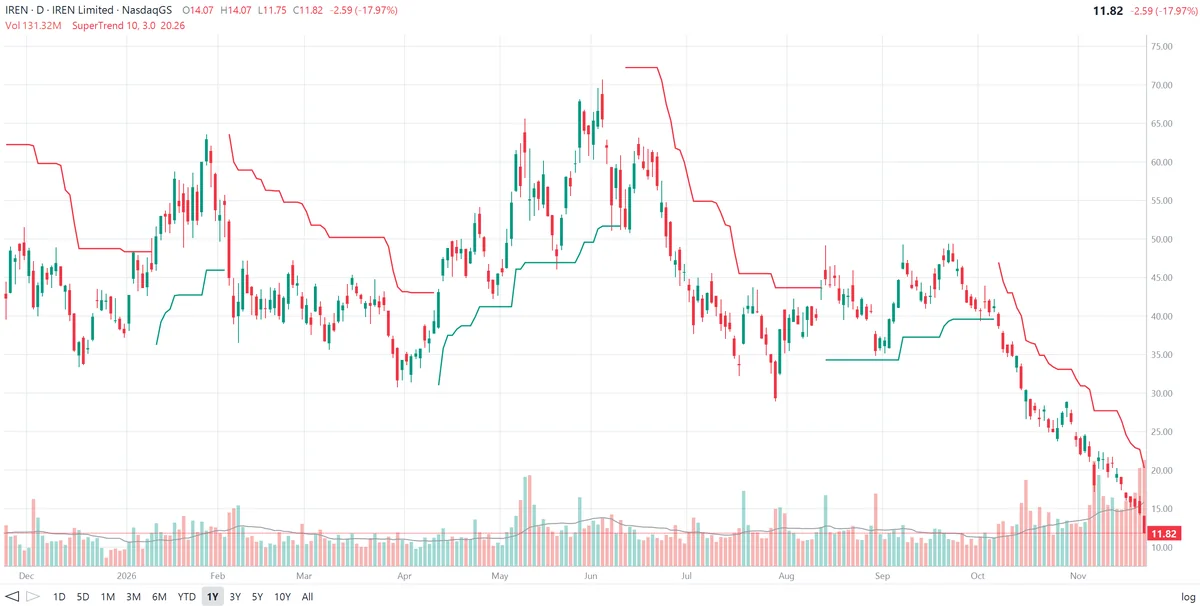
What the line shows on this chart:
- Few flips for a wild stock. IREN swung between about $12 and $71 over the year, often moving 5–10% in a day, yet Supertrend flipped only six times. Because the bands are set three ATRs away, ordinary daily swings don’t trigger a flip.
- The flat stretches. From February to early April the red line stepped down from about $63 to $50 and then stayed flat near $50 for most of March while IREN traded between about $37 and $47. A flat line means price isn’t making new lows fast enough to pull the band down, not that the trend has ended.
- Catching the spring rally. In April the close broke above the red line near $43, and Supertrend flipped green near $31. As IREN rallied to about $70 in June, the green line stepped up through about $39, $46 and $52, never forcing an exit on the pullbacks in May.
- Exit after the top. About a week after the June high the close broke below the green line near $52 and Supertrend flipped red. The exit was roughly $19 below the high, which is the price of giving the stock three ATRs of room. The red line then stepped down from about $72 to $45 as IREN slid toward $30.
- A late-summer failure. In mid-August IREN jumped back above the red line and Supertrend flipped green near $35, but the rally stalled below $50. Early in October the close broke the green line near $40 and the line flipped red.
- The latest reading. Since that flip IREN has fallen from about $40 to $11.82, and the red line has followed it down from about $47 to $20.26. After the 18% drop on the last day, the line is still about 71% above the close: in a fast decline, three ATRs is a lot of room. The trend is down until a close above the line, and with the line this far away that would take a very large rally.
How traders use Supertrend
1. Trend filter
Take only long trades while the line is green and only short trades (or stay out) while it is red. This is the simplest and most common use.
2. Trailing stop
Enter by any method and place the stop at the Supertrend line, moving it as the line moves. Because the line never moves against the trade, the stop only tightens.
3. Flip entries
Some traders buy on a red-to-green flip and sell on a green-to-red flip. Signals are more reliable when confirmed by another tool, such as an ADX above 20–25 or price above its 200-day moving average.
4. Multiple time frames
A weekly Supertrend sets the direction and a daily one times entries: buy daily green flips only while the weekly line is green.
Supertrend vs Parabolic SAR
| Supertrend | Parabolic SAR | |
|---|---|---|
| Distance from price | Set by volatility (multiple of ATR) | Set by time and new extremes (acceleration factor) |
| When price stalls | Line goes flat and waits | Dots keep moving toward price until they flip |
| Flip trigger | Close through the line | Intraday high or low touching the dots |
| Typical result | Fewer flips, larger give-back at the end of a trend | More flips, tighter exits in fast trends |
Limitations of Supertrend
- Late exits. With a multiplier of 3, the line can be far from price at the end of a fast move, so a lot of profit is given back before it flips.
- Whipsaws in ranges. In a sideways market that is wider than the bands, price crosses the line back and forth.
- Gaps. A gap through the line fills a stop well beyond the Supertrend level, as can happen on a stock like IREN.
- One line, one view. Supertrend says nothing about trend strength or momentum; it only says which side of the line price is on.
- Not a prediction. Confirm with volume, support and resistance, and the company’s fundamentals.
Frequently asked questions
What is the Supertrend indicator?
Supertrend is a trend-following line built from the Average True Range. In an uptrend it runs below price and can only rise; in a downtrend it runs above price and can only fall. When price closes through the line, Supertrend flips to the other side and changes color.
How is Supertrend calculated?
Take the bar’s midpoint, (high + low) / 2, and add or subtract a multiple of the Average True Range: upper band = midpoint + multiplier × ATR, lower band = midpoint − multiplier × ATR. In an uptrend Supertrend follows the lower band, which may only rise; in a downtrend it follows the upper band, which may only fall.
What are the best Supertrend settings?
The most common default is an ATR period of 10 and a multiplier of 3, written Supertrend(10, 3). A smaller multiplier such as 2 keeps the line closer to price and flips more often; a larger one such as 4 gives fewer, later signals.
What is the difference between Supertrend and Parabolic SAR?
Both trail price and flip sides on a reversal. The Parabolic SAR accelerates toward price as a trend extends, whatever the volatility. Supertrend keeps a distance set by volatility (ATR) and can stay flat for weeks, so it usually gives fewer flips in strong but choppy trends.
Is Supertrend a buy or sell signal?
A flip from red (above price) to green (below price) is read as a buy signal, and the opposite as a sell signal. Many traders use it mainly as a trailing stop and trend filter rather than as an entry signal on its own.
Does Supertrend repaint?
On a finished bar, no: its value depends only on prices that are already known. During a bar that is still trading, the line and its color can change until the bar closes, which is why signals are usually taken on the close.