What is the Parabolic SAR?
J. Welles Wilder introduced the Parabolic SAR in 1978, in the same book as the Average Directional Index. He designed it as a complete trading system that is always in the market: long while the dots are below price, short while they are above, and when price hits the dots you stop out and reverse, hence “stop and reverse”.
The name comes from the shape of the dots. At the start of a trend they move slowly; every time price makes a new extreme they speed up, so in a long trend they curve toward price like a parabola. That acceleration is the point: the longer a trend runs, the tighter the stop gets, locking in more of the move.
- ▲Dots below priceUptrend mode. Each dot is a trailing stop for a long position and can only rise.
- ▼Dots above priceDowntrend mode. Each dot is a stop for a short position and can only fall.
- ⇅FlipPrice touches the dots: the SAR jumps to the other side and a new trend count starts.
Parabolic SAR formula
Each day’s SAR is calculated from the previous one, the extreme point of the current trend and an acceleration factor:
EP (extreme point) = highest high of the current uptrend, or lowest low of the current downtrend · AF (acceleration factor) = 0.02 at the start of a trend, +0.02 each time a new EP is set, capped at 0.20
Three rules complete the calculation:
- Never inside the last two bars. In an uptrend the SAR may not be above either of the previous two lows; in a downtrend it may not be below either of the previous two highs. If the formula says otherwise, the SAR is set to that low (or high).
- Reversal. When the low of a bar falls below the SAR in an uptrend (or the high rises above it in a downtrend), the trend flips. The new SAR is the EP of the trend that just ended, AF resets to 0.02, and the new EP is the extreme of the current bar.
- Moving in one direction only. During an uptrend the SAR rises every day, even if price goes sideways; during a downtrend it falls every day. That is what eventually forces a flip when a trend stalls.
Worked example: an uptrend and a flip
A stock is in an uptrend with SAR = $100.00, extreme point = $110.00 (the highest high so far) and AF = 0.02. The table shows the SAR in force for each day and how the next one is built.
| Day | High / Low | SAR for the day | EP / AF after the day | Next SAR |
|---|---|---|---|---|
| 0 | – | $100.00 | 110 / 0.02 | 100.00 + 0.02 × (110 − 100.00) = $100.20 |
| 1 | $112 / $106 | $100.20 | 112 / 0.04 (new high) | 100.20 + 0.04 × (112 − 100.20) = $100.67 |
| 2 | $115 / $108 | $100.67 | 115 / 0.06 (new high) | 100.67 + 0.06 × (115 − 100.67) = $101.53 |
| 3 | $113 / $107 | $101.53 | 115 / 0.06 (no new high) | 101.53 + 0.06 × (115 − 101.53) = $102.34 |
| 4 | $108 / $101.90 | $102.34 | low $101.90 is below the SAR: flip | new downtrend: SAR $115.00, EP 101.90, AF 0.02 |
Notice how the step grows: the SAR moved up 20 cents after day 0, 47 cents after day 1 and 86 cents after day 2, because both the gap to the extreme point and the acceleration factor increased. On day 3 there was no new high, so AF stayed at 0.06, but the SAR still rose. On day 4 the low pierced the SAR at $102.34: the long trade is stopped out, and the indicator jumps to $115.00, the high of the uptrend that just ended, now above price.
Settings: step and maximum
| Setting | Effect |
|---|---|
| 0.02 / 0.20 (standard) | Wilder’s defaults; the version shown on most charts, written SAR(0.02, 0.2) |
| Smaller step, e.g. 0.01 / 0.10 | Dots start further from price and accelerate more slowly; fewer flips, later exits |
| Larger step, e.g. 0.03 / 0.30 | Dots hug price; earlier exits, more whipsaws |
The step sets how fast the SAR accelerates; the maximum caps how close it can get to price in a long trend.
Reading the Parabolic SAR on a chart: American Express (AXP)
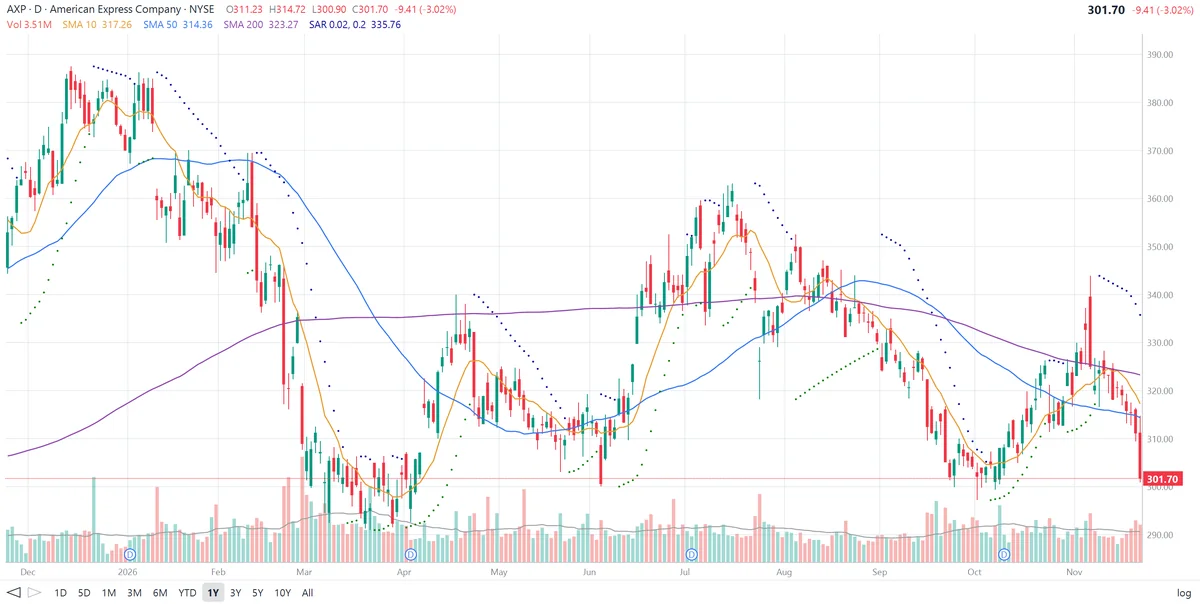
The daily chart of American Express (AXP) below covers one year with SAR(0.02, 0.2) dots (green below price, dark blue above) and the 10, 50 and 200-day SMAs.
What the dots show on this chart:
- A trend the SAR rode well. From mid-February to mid-March the dots stayed above price and stepped down every day, from about $370 to $308, as AXP fell from the mid-$360s to below $300. A trader using the dots as a stop on a short position would have stayed in for the whole decline.
- Whipsaws in a range. In March AXP moved sideways between roughly $290 and $310 and the SAR flipped five times in about three weeks. Each flip was a losing signal. This is the indicator’s main weakness.
- Rallies caught early. The SAR flipped below price at the start of April, near $292, and again in early June, near $300. Both times the dots then rose under rallies of $45–$60, to about $340 in April and about $360 in July.
- The September–October decline. At the start of September the SAR flipped above price near $353, then stepped down every day for a month while AXP fell from about $345 to below $300. It flipped back below price in early October, near the low.
- The latest flip. AXP spiked to about $344 in early November but couldn’t hold it. The SAR flipped above price on that reversal and has been falling slowly since; it is now at $335.76, about 11% above the $301.70 close, so the indicator is in downtrend mode. Price is also below the 10, 50 and 200-day SMAs. The next flip would need a close back above the dots, which are falling a little faster each time AXP makes a new low.
Across the year the SAR flipped more than 20 times. The long, clean trends (February–March, June, September) paid for many small losses in the choppy stretches, which is how trend-following systems usually behave.
How traders use the Parabolic SAR
1. Trailing stop
The most popular use: enter a trade by any method, then move the stop to the SAR every day. Because the dots accelerate, the stop tightens as the trend matures and locks in more profit the longer the move lasts.
2. Trend direction
Dots below price mean the short-term trend is up; dots above mean it is down. Many traders only take long setups while the dots are below price.
3. Filtered reversals
Because the SAR is always in the market, its flips are most useful when a trend is actually present. A common filter is to act only when the ADX is above 20 or 25, or only in the direction of a longer moving average, such as the 200-day.
Limitations of the Parabolic SAR
- Whipsaws in sideways markets. The SAR has no “neutral” state, so it flips repeatedly when price moves sideways, as on AXP in March and July. The ATR-based Supertrend flips less often because its line can go flat.
- Gaps. A large overnight gap can carry price far through the dots, so the actual exit is worse than the SAR level.
- Forced exits in slow trends. Because the SAR rises every day, a trend that pauses for a few days can trigger a flip even if it later resumes.
- Not a prediction. A flip means the latest trend has stalled, not that a new one has begun. Confirm with price action, volume, support and resistance.
Frequently asked questions
What is the Parabolic SAR?
The Parabolic SAR (stop and reverse) is a trend-following indicator by J. Welles Wilder drawn as a series of dots. In an uptrend the dots sit below price and rise every day; in a downtrend they sit above price and fall. When price crosses the dots, the SAR flips to the other side and signals a possible reversal.
What do the dots mean?
Dots below the candles mean the indicator is in an uptrend (long) mode, and each dot is a trailing stop level for a long position. Dots above the candles mean a downtrend (short) mode, and each dot is a stop level for a short position.
How is the Parabolic SAR calculated?
Next SAR = current SAR + AF × (EP − current SAR). EP, the extreme point, is the highest high of the uptrend or the lowest low of the downtrend. AF, the acceleration factor, starts at 0.02, rises by 0.02 every time a new extreme point is set, and is capped at 0.20.
What are the default Parabolic SAR settings?
Wilder’s defaults are a step of 0.02 and a maximum of 0.20, often written SAR(0.02, 0.2). A smaller step makes the dots trail further from price and flip less often; a larger step keeps them tighter and makes them flip more often.
Does the Parabolic SAR work in sideways markets?
Poorly. Because it is always either long or short, the SAR flips back and forth when price moves sideways, producing a string of small losing signals. Traders often use a trend-strength filter such as ADX and act on SAR flips only when ADX is above 20 or 25.
What does stop and reverse mean?
Wilder designed the SAR as a complete system: when price hits the stop level, you close the current position and open one in the opposite direction at the same time. Most traders today use it only as a trailing stop or a trend signal, not as an always-in-the-market system.