- What it is
- The five lines
- Formula
- Worked example
- Reading the chart
- Trading signals
- Settings
- Limitations
- FAQ
What is the Ichimoku Cloud?
Japanese journalist Goichi Hosoda developed Ichimoku before World War II and published it in 1969 after decades of testing. Instead of averaging closing prices like a moving average, every Ichimoku line is a midpoint: the average of the highest high and lowest low over a period. That makes the lines flat when price stays inside its recent range and step sharply when price breaks out of it.
Two of the lines are shifted 26 periods into the future to form the cloud (kumo), and one is shifted 26 periods into the past. So an Ichimoku chart shows three time frames at once: the current price, a projected support and resistance zone ahead of it, and today’s close compared with the price of a month ago.
The five Ichimoku lines
- TKTenkan-sen (conversion line)Midpoint of the last 9 periods. The fast line, a short-term trend and momentum gauge.
- KJKijun-sen (base line)Midpoint of the last 26 periods. The medium-term balance point, often used as a trailing stop.
- SASenkou Span A (leading span A)Average of Tenkan and Kijun, plotted 26 periods ahead. One edge of the cloud.
- SBSenkou Span B (leading span B)Midpoint of the last 52 periods, plotted 26 periods ahead. The other, slower edge of the cloud.
- CHChikou Span (lagging span)Today’s close plotted 26 periods back, to compare it with the price of a month ago.
Ichimoku formulas
both plotted 26 periods ahead; the shaded area between them is the cloud
Highn / Lown = highest high / lowest low of the last n periods, including today
The cloud is usually drawn green when Span A is above Span B and red when Span B is above Span A. Because Span B uses the longest range, it is the flattest line; long flat stretches of Span B often mark strong support or resistance.
Worked example
Suppose a stock closes today at $57. Over the last 9 days its range was $52–$58, over the last 26 days $46–$60, and over the last 52 days $40–$64. Twenty-six days ago it closed at $50.
| Line | Calculation | Value | Reading |
|---|---|---|---|
| Tenkan-sen | (58 + 52) / 2 | $55.00 | Price is above it |
| Kijun-sen | (60 + 46) / 2 | $53.00 | Price is above it; Tenkan is above Kijun |
| Senkou Span A | (55 + 53) / 2 | $54.00 | Plotted 26 days ahead |
| Senkou Span B | (64 + 40) / 2 | $52.00 | Plotted 26 days ahead |
| Future cloud | Span A above Span B | $52 – $54 | Green, below today’s price |
| Chikou Span | $57 plotted 26 days back | $57 vs $50 | Above the price of a month ago |
Every component agrees: price above the cloud, Tenkan above Kijun, a green cloud ahead, and a Chikou Span above past price. That is the full bullish Ichimoku setup. Note that if the stock now traded sideways between $52 and $58, the Tenkan-sen would not move at all, because neither the 9-day high nor low would change.
Reading the Ichimoku Cloud on a chart: Western Digital (WDC)
The daily chart of Western Digital (WDC) below covers one year with Ichimoku (9, 26, 52): Tenkan-sen in blue, Kijun-sen in dark red, the Chikou Span as the green line that ends 26 bars before the last candle, and the cloud shaded green or red, extending 26 bars past the last candle.
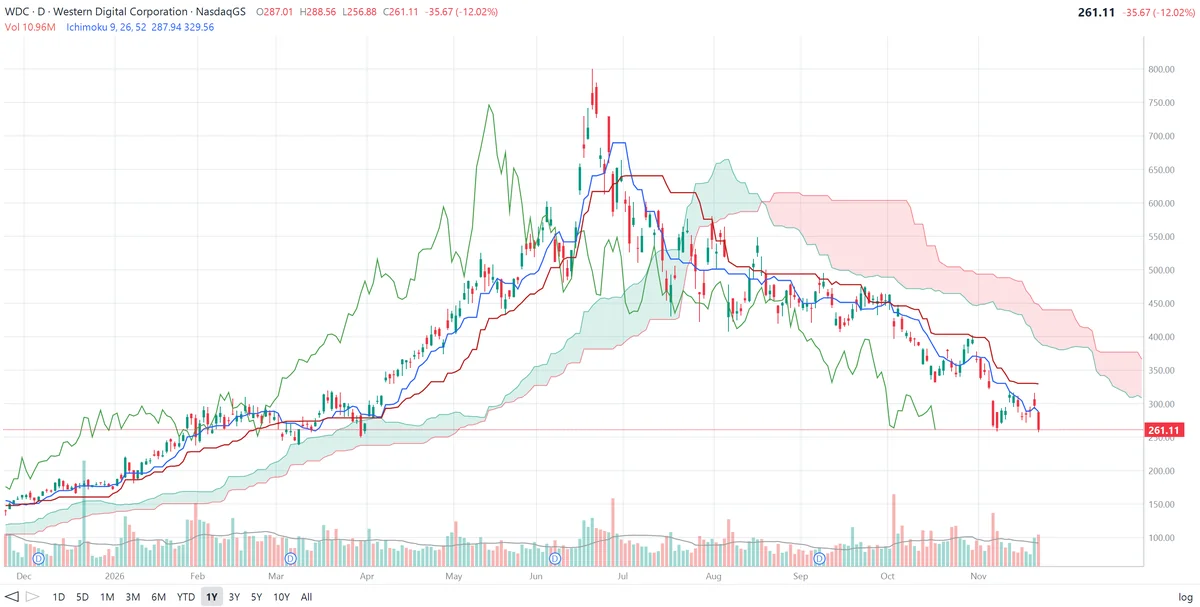
What the Ichimoku lines show on this chart:
- A textbook uptrend. From December to February WDC climbed from about $150 to about $290 with every component bullish: price above a rising green cloud, Tenkan above Kijun, and the Chikou Span far above the candles of a month earlier.
- The cloud as support. In late February and March WDC pulled back into the $250s. The Tenkan dipped briefly below the Kijun, but price only reached into the top of the green cloud, and the cloud held. From April the rally resumed.
- A parabolic run. From April to late June WDC rose from about $270 to an intraday high near $800. The Tenkan pulled far above the Kijun and price sat far above the cloud: momentum at an extreme, which is also when Ichimoku traders start trailing stops along the Kijun.
- The turn. In early July the Tenkan crossed below the Kijun, around $610–$640, and the Kijun went flat at about $640, then stepped down. By late July and August price was inside the cloud, and the cloud ahead twisted from green to red: the projected balance had turned bearish.
- Below the cloud. From September WDC traded below the red cloud, with Tenkan under Kijun and the Chikou Span below past price: the full bearish setup, the mirror image of the winter. The Kijun stepped down from about $490 to $330, and each rally (late October near $400 being the clearest) stalled at or just under the Kijun.
- The latest reading. After a 12% drop to $261.11, price is about 9% below the Tenkan ($287.94) and about 21% below the Kijun ($329.56), with the cloud near $395–$450 above it. The projected cloud keeps falling: its lower edge 26 bars ahead is Span A = (287.94 + 329.56) / 2 = $308.75, which matches the bottom of the red cloud at the right edge of the chart. The first resistance on any rebound is the Tenkan, then the Kijun.
Ichimoku trading signals
1. Price vs the cloud
Price above the cloud means an uptrend, below means a downtrend, inside means no clear trend. A close through the cloud (a kumo breakout) is one of the strongest Ichimoku signals, especially through a thin cloud.
2. TK cross
The Tenkan crossing above the Kijun is bullish; crossing below is bearish. A bullish cross above the cloud is a strong signal, inside the cloud neutral, and below the cloud weak, and the reverse for bearish crosses.
3. Kijun as support and stop
In a trend, price often pulls back to the Kijun-sen and bounces. Many traders put their stop just beyond the Kijun and move it as the line steps.
4. Chikou confirmation
The Chikou Span above the price of 26 periods ago confirms an uptrend; below confirms a downtrend. When it runs into the old candles, those prices often act as support or resistance.
5. Kumo twist and cloud thickness
When Span A crosses Span B, the cloud ahead changes color: an early, low-weight sign of a trend change. A thick cloud is strong support or resistance; a thin cloud is easier for price to break through.
Settings
| Settings | Use |
|---|---|
| 9, 26, 52 (standard) | Hosoda’s original values, from a six-day trading week: about 1½ weeks, one month and two months. The default almost everywhere. |
| 10, 30, 60 | Sometimes used for 24/7 markets such as crypto, to match a seven-day week |
| Weekly or monthly charts | The standard settings on longer bars give long-term support and resistance zones |
Limitations of the Ichimoku Cloud
- Busy charts. Five lines and a cloud can hide the price itself, which is why many traders start with just price, the cloud and the Kijun.
- Lag. All lines are based on past ranges; the cloud is “projected” forward only in the sense that it is shifted, not forecast.
- Sideways markets. When price moves inside the cloud the lines tangle and signals contradict each other.
- Built for trends. In a strong move price can sit far from the cloud for a long time, so the cloud says little about where a correction will stop, as on WDC at $800.
- Not a prediction. Combine Ichimoku with volume, price action and the company’s fundamentals.
Frequently asked questions
What is the Ichimoku Cloud?
The Ichimoku Cloud (Ichimoku Kinko Hyo) is a Japanese charting system made of five lines: the Tenkan-sen, Kijun-sen, Senkou Span A, Senkou Span B and Chikou Span. The area between the two Senkou Spans is shaded as the cloud. Together they show trend direction, momentum and support and resistance in one view.
How is the Ichimoku Cloud calculated?
Tenkan-sen = (9-period high + 9-period low) / 2. Kijun-sen = (26-period high + 26-period low) / 2. Senkou Span A = (Tenkan + Kijun) / 2 and Senkou Span B = (52-period high + 52-period low) / 2, both plotted 26 periods ahead. Chikou Span = today’s close plotted 26 periods back.
What does it mean when price is below the cloud?
Price below the cloud is read as a downtrend, price above the cloud as an uptrend, and price inside the cloud as no clear trend. The cloud itself often acts as resistance from below and support from above.
What does a green or red cloud mean?
The cloud is usually green when Senkou Span A is above Senkou Span B and red when Span B is above Span A. A change of color, called a Kumo twist, shows that the balance between shorter and longer-term price ranges has flipped.
What is a TK cross?
A TK cross is a crossover of the Tenkan-sen and Kijun-sen. Tenkan crossing above Kijun is bullish and crossing below is bearish. It is considered strongest when it happens on the same side of the cloud as the signal, for example a bullish cross above the cloud.
Why are the settings 9, 26 and 52?
Goichi Hosoda developed Ichimoku in Japan when markets traded six days a week, so 9 periods was about a week and a half, 26 about a month and 52 about two months. Most traders keep these defaults on daily charts.