- What it is
- SMA, EMA, WMA
- Weights and lag
- Reading the chart
- Choosing a period
- Strategies
- Other averages
- Limitations
- FAQ
What is a moving average?
A moving average takes the last N closing prices, averages them, and plots the result. On the next bar the newest close enters and the oldest leaves, so the average “moves” along with the chart. A 50-day moving average on a daily chart is the average close of the last 50 trading days, updated every day.
Averaging hides the day-to-day noise, so the line shows the underlying trend: rising when prices are generally going up, falling when they are going down, flat when the stock is moving sideways. The price of that smoothness is lag: every moving average is built from past prices, so it always turns after price does.
The three main types: SMA, EMA and WMA
All moving averages share the same idea. They differ only in how much each past close counts.
- SMASimple Moving AverageEvery close in the window counts equally. Smoothest and the most widely quoted; the standard for the 50 and 200-day averages.
- EMAExponential Moving AverageThe newest close counts most and weights shrink geometrically. Turns sooner; the building block of MACD.
- WMAWeighted Moving AverageWeights fall in a straight line to zero after N bars. Lags least of the three; the base of the Hull Moving Average.
| SMA | EMA | WMA | |
|---|---|---|---|
| Weighting | Equal | Geometric, newest first | Linear, newest first |
| Weight on today’s close | 1 / n | 2 / (n + 1) | 2 / (n + 1) |
| Uses prices older than n bars | No | Yes, with ~14% of the weight | No |
| Lag in a steady trend | (n − 1) / 2 bars | (n − 1) / 2 bars | (n − 1) / 3 bars |
| Drop-off effect | Yes | No | Mild |
| Typical periods | 10, 20, 50, 200 | 9, 12, 21, 26, 50 | 10, 20, 30 |
| Best for | Long-term trend, widely watched levels | Short-term trading, crossovers, MACD | Fast trend following with little lag |
| Formula and example | SMA formula | EMA formula | WMA formula |
How the weights compare, and why it matters
The chart below shows how much each of the last 30 closes counts in a 20-period SMA, EMA and WMA. In each, the weights add up to 100%; the three just spread it differently.
More weight near “today” means less lag. In a stock that rises by the same amount every day, a 20-period SMA and EMA settle about 9.5 bars behind price and a 20-period WMA about 6.3 bars behind. The EMA’s edge over the SMA shows up elsewhere: it reacts sooner right after a turn, and it never jumps just because an old price left the window. The WMA page has the full lag table.
Less lag is not free. A faster average sits closer to price, so price crosses it more often, including in sideways markets where those crossings lead nowhere. Choosing a moving average is always a trade-off between speed and false signals.
Reading six moving averages on one chart: AT&T (T)
The daily chart of AT&T (T) below covers one year with six averages: the 10, 50 and 200-day SMAs, the 9 and 21-period EMAs and the 20-period WMA.
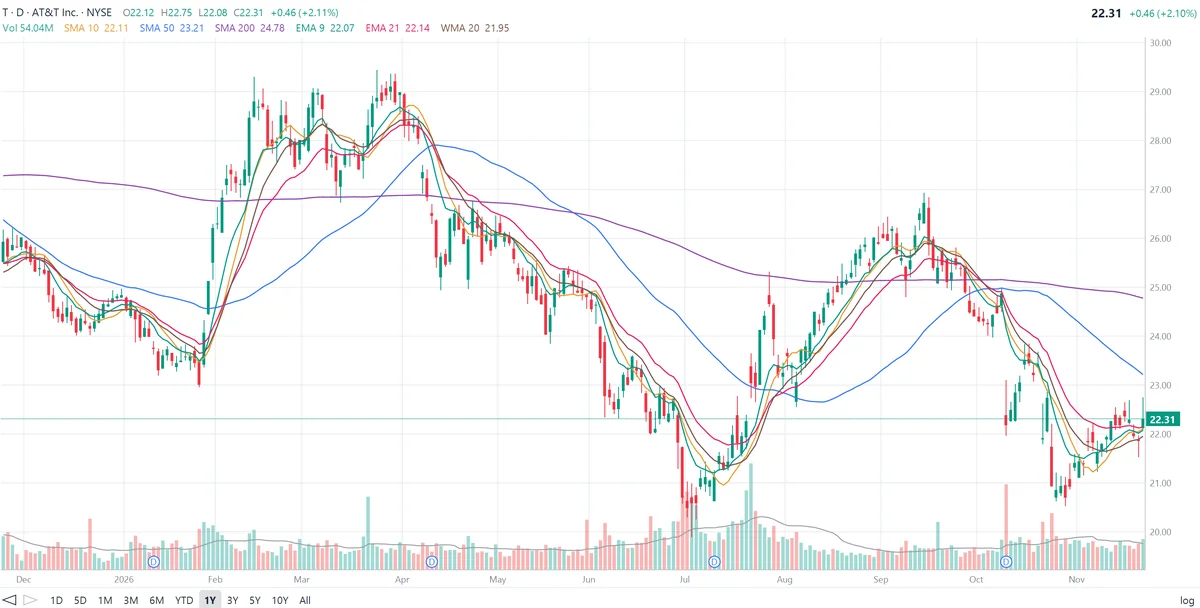
| Average | Line | Value | Close vs average |
|---|---|---|---|
| WMA 20 | brown | $21.95 | +1.6% |
| EMA 9 | green | $22.07 | +1.1% |
| SMA 10 | orange | $22.11 | +0.9% |
| EMA 21 | red | $22.14 | +0.8% |
| SMA 50 | blue | $23.21 | −3.9% |
| SMA 200 | purple | $24.78 | −10.0% |
What the six lines show:
- The short averages move as a bundle. The 9 EMA, 10 SMA, 20 WMA and 21 EMA stay within a few percent of price and of each other all year. The faster ones (9 EMA, 20 WMA) turn first at every swing; the 21 EMA turns last. Together they show the short-term trend.
- The February breakout. After a slide from about $26 to $23 in December and January, T jumped to about $28.5 in a few weeks. The short averages turned up, crossed above the 50-day SMA and stayed stacked in bullish order (fast above slow) through March, while price cleared the 200-day.
- The death cross. In April the short averages rolled over and price fell back below the 200-day SMA. In May the falling 50-day crossed below the 200-day, a death cross. It came weeks after the top near $29.5 and well before the low near $20.6 in early July.
- A golden cross that didn’t happen. The rally from July to mid-September took T back to about $27 and above the 200-day. The 50-day SMA turned up, but it peaked at about $25 in early October, just under the 200-day, and turned down again without crossing it.
- The long averages as resistance. After the October slide, which included a gap down on heavy volume and a low near $20.6, T is rebounding. Price sits just above all four short averages, which have flattened and bunched together between $21.95 and $22.14. The 50-day ($23.21) and 200-day ($24.78) are both falling and above price, so the medium and long-term trend is still down. The 50-day is the first level a rally would have to clear.
Choosing a period
| Horizon | Common periods | Used for |
|---|---|---|
| Short term | 9, 10, 20, 21 | Swing trading, entries and exits, trailing stops |
| MACD | 12 and 26 (EMA) | Momentum; MACD line and its 9-period signal line |
| Medium term | 50 | Intermediate trend; first support in an uptrend |
| Intermediate | 100 | Trend over about five months |
| Long term | 200 | Separates long-term uptrends from downtrends |
The rule of thumb: match the average to how long you plan to hold. A trader holding for days watches the 9 or 21; an investor holding for years watches the 200. On weekly charts, the 10-week and 40-week averages roughly match the 50 and 200-day.
Moving average strategies
Trend filter
The simplest use: take only long trades when price is above a rising 200-day average and only short trades (or stay out) when it is below a falling one.
Price crossover
A close above the average after a decline signals a possible up-move; a close below after a rise signals a possible down-move. Short averages give early but noisy signals; long ones give late but more reliable ones.
Two-average crossover
A fast average crossing above a slow one (9 over 21 EMA, 10 over 30 WMA) signals that short-term momentum has turned up; a cross below signals it has turned down. This filters some of the noise of single-average crossovers.
Golden cross and death cross
The 50-day crossing above the 200-day is a golden cross; crossing below is a death cross. They are slow, widely reported signals that confirm a long-term trend change, as the May death cross on the AT&T chart did.
Support and resistance
In an uptrend, pullbacks often stop near the 20, 50 or 200-day average, which acts as dynamic support. In a downtrend, rallies often fail at the same lines, which then act as resistance.
Stacking and compression
When short averages sit above medium ones and those above long ones, all rising, the trend is strong across time frames. When the averages bunch together and flatten, as T’s short averages have, the market is undecided, and a larger move often follows once price breaks away from the bundle.
Other moving averages
- Hull Moving Average (HMA): combines WMAs of different lengths to cut lag almost to zero while staying smooth.
- DEMA and TEMA: double and triple exponential averages that subtract part of the EMA’s lag.
- Smoothed / Wilder moving average: an EMA with α = 1 / n, used inside RSI, ATR and ADX.
- Volume-weighted moving average (VWMA): weights each close by that bar’s volume, so heavy-volume days count most.
- Adaptive averages (KAMA and others): speed up when price trends and slow down when it moves sideways.
- Midpoint lines: the Ichimoku Cloud uses the midpoint of the highest high and lowest low instead of an average of closes.
Limitations
- Lag. Every moving average turns after price does; a faster average lags less but gives more false signals.
- Whipsaws. In sideways markets price crosses its averages again and again without a lasting move.
- Gaps. A sudden gap, like T’s in October, can carry price far beyond the averages before they react.
- No single right setting. A period that worked on one stock or in one year may not work on another.
- No prediction. Moving averages describe the trend that has already formed. Combine them with volume, price action and the company’s fundamentals.
Frequently asked questions
What is a moving average in stocks?
A moving average is the average of a stock’s last N closing prices, recalculated on every new bar and drawn as a line on the chart. It smooths out day-to-day noise so the direction of the trend is easier to see.
What is the difference between SMA, EMA and WMA?
They differ in how much each past close counts. The SMA weights every close in its window equally. The EMA gives the newest close the most weight, with weights shrinking geometrically. The WMA also favors the newest close, with weights falling in a straight line to zero after N bars. For the same period, the WMA lags least in a steady trend and the SMA is smoothest.
Which moving average is best?
There is no single best one. The 50 and 200-day SMAs are the standard for the medium and long-term trend, short EMAs such as the 9 and 21 suit swing trading, and the WMA is useful when a fast but smooth line is needed. Many traders combine a short and a long average.
What are a golden cross and a death cross?
A golden cross is when the 50-day moving average crosses above the 200-day moving average, read as a bullish long-term signal. A death cross is when the 50-day crosses below the 200-day. Both confirm a trend change that is already under way rather than predict one.
What moving average periods are most common?
For daily charts, 9 to 21 periods are used for the short-term trend, 50 for the medium-term trend and 200 for the long-term trend. The 12 and 26-period EMAs are the basis of MACD.
Do moving averages predict prices?
No. Moving averages are built from past prices, so they always lag and only describe the trend that has already formed. They are most useful combined with volume, price action and other indicators.