What is the Average True Range?
The simplest measure of a day’s movement is its high minus its low. That misses gaps: a stock that closes at $100 and opens at $90 has moved $10 before the new day’s range even starts. Wilder’s true range fixes this by stretching the day’s range back to the previous close whenever the stock gapped. ATR is the smoothed average of those true ranges, usually over 14 bars.
The result is in dollars per bar. An ATR of 9.13 says the stock has recently been moving about $9 a day from extreme to extreme, gaps included. Because it is in price units, ATR is most useful against the stock’s own history, or divided by the price to compare different stocks.
ATR formula
n = 14 by default; the first ATR is the simple average of the first n true ranges
Wilder’s smoothing is an exponential average with a weight of 1/n on the newest bar, equivalent to an EMA of about 2n − 1 = 27 periods. Each new true range moves ATR only a fraction of the way, which is why the line changes gradually even after a huge day.
Worked example: Palantir’s last bar
The chart below ends with this daily bar for Palantir (PLTR): open $149.70, high $152.51, low $142.28, close $143.49, down $10.19 from the previous close of $153.68.
| Measure | Calculation | Value |
|---|---|---|
| High − Low | 152.51 − 142.28 | $10.23 |
| |High − previous close| | |152.51 − 153.68| | $1.17 |
| |Low − previous close| | |142.28 − 153.68| | $11.40 (true range) |
The stock opened below the previous close and never got back to it, so the true range runs from the previous close down to the low: $11.40, more than the $10.23 high-low range. With the chart’s ATR (14) of 9.13 after this bar, Wilder’s formula gives the value one bar earlier:
| Step | Calculation | Result |
|---|---|---|
| Previous ATR | (14 × 9.13 − 11.40) / 13 | 8.96 |
| New ATR | (13 × 8.96 + 11.40) / 14 | 9.13 |
A true range of $11.40, about 27% above the average, lifted ATR by only $0.17. That damping is deliberate: one big day nudges ATR, but a run of big days lifts it a lot.
Reading ATR on a chart: Palantir (PLTR)
The daily chart of Palantir Technologies (PLTR) below covers one year. The upper panel shows price with the 10, 50 and 200-day SMAs and volume; the lower panel shows ATR (14).
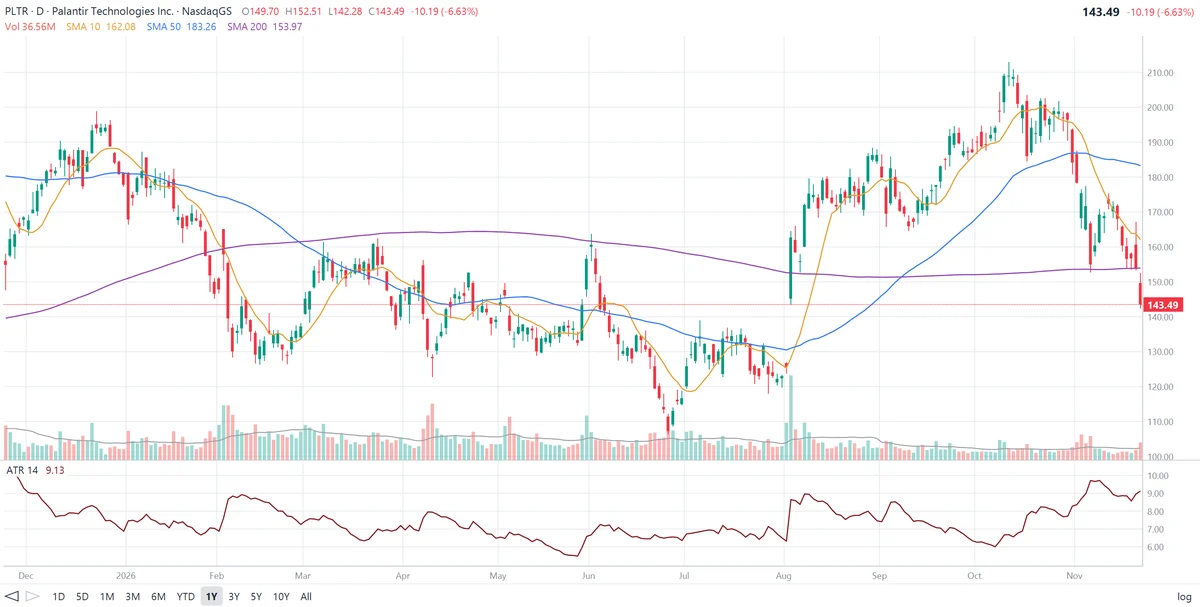
What ATR shows on this chart:
- Calming down into December. The chart opens with ATR above 10, its highest reading on the chart, and it eased to about 7 to 8 through December as Palantir climbed to about $199.
- The February shock. ATR had dipped to about 6.7 in late January. Then Palantir fell from about $165 to below $130 in early February, with several wide red candles, and ATR jumped to about 8.9 within days.
- The quietest stretch. From March to May the stock traded mostly between about $128 and $150 and ATR drifted down to about 5.5 in late May, its low for the year. The quiet ended with a jump to about $164 at the start of June.
- A big decline with a low ATR. In late June Palantir slid to about $108, its lowest price of the year, yet ATR stayed around 6.5 to 7. The fall came from many moderate down days, not a few huge ones. ATR measures the size of daily moves, not how far a trend has run.
- The August gap. In early August the stock gapped from about $125 to the low $160s on the year’s heaviest volume. True range counted the full gap, and ATR jumped from about 6.4 to about 9.0, the sharpest rise on the chart.
- A quiet uptrend. From September to mid-October Palantir climbed to about $212, its high for the year, while ATR fell back to about 6 in early October. Steady trends often have falling ATR.
- The latest reading. The reversal from the October high to the mid-$150s pushed ATR to about 9.7 in early November. After a brief dip to about 8.7, the latest drop to $143.49 lifted it back to 9.13. That is about 6.4% of the price per day. Price is below all three moving averages.
How traders use ATR
1. Stop distances
Instead of a fixed dollar or percentage stop, traders place stops a multiple of ATR away, often 2 to 3 × ATR. On Palantir, a 2 × ATR stop below the $143.49 close would sit at 143.49 − 2 × 9.13 = $125.23. A chandelier stop hangs the same distance below the highest high since entry and rises with it. Supertrend builds a whole trend indicator on this idea.
2. Position sizing
To risk a fixed amount per trade, divide that amount by the stop distance. Risking $1,000 with a 2 × ATR stop on Palantir allows 1,000 / 18.26 ≈ 54 shares. A quieter stock with half the ATR would allow twice as many. This keeps the dollar risk similar across volatile and calm stocks.
3. Volatility regime
A low ATR relative to the stock’s history marks a quiet market, which often comes before a larger move, as Palantir’s late-May low did before the June jump. A sharp rise in ATR marks a shock or a change in behaviour. Many traders reduce position size when ATR is high.
4. Targets and filters
ATR gives a sense of a realistic daily move: a target of 1 ATR is achievable in a day, 5 ATRs is not. Some traders also treat a move larger than 1 to 2 × ATR in one bar as a meaningful breakout rather than noise.
ATR settings
| Setting | Use |
|---|---|
| 14 (default) | Wilder’s original; most charting platforms and stop rules |
| 5 to 10 | Faster; reacts sooner to new volatility. Supertrend often uses 10 |
| 20 to 21 | About a month; smoother, used in some position-sizing systems |
Some platforms let you change the smoothing from Wilder’s method to a simple or exponential average. The readings differ slightly, so stop rules should use the same ATR setting every time.
Limitations of ATR
- No direction. ATR rises in sell-offs and in rallies; it cannot tell you which way the stock is moving.
- In dollars. ATR depends on the share price, so compare stocks using ATR divided by price, and remember that a stock’s ATR changes as its price changes.
- Lag. Wilder’s smoothing reacts slowly: after a single huge day, ATR rises only a little, and it stays elevated for weeks after volatility has calmed down.
- Gaps beyond the stop. An ATR stop cannot protect against an overnight gap larger than the stop distance.
- Not a prediction. Combine ATR with the trend, support and resistance, volume and fundamentals.
Frequently asked questions
What is the Average True Range (ATR)?
The Average True Range is a volatility indicator introduced by J. Welles Wilder in 1978. It shows how much a stock typically moves in one bar, in dollars, including any gap from the previous close. A higher ATR means wider daily swings; a lower ATR means a quieter market. It says nothing about direction.
How is ATR calculated?
First find each bar’s true range: the largest of high − low, |high − previous close| and |low − previous close|. ATR is a 14-period average of true range using Wilder’s smoothing: ATR today = (13 × ATR yesterday + true range today) / 14. The first value is a simple average of the first 14 true ranges.
Why does ATR use the previous close?
Using the previous close counts gaps. If a stock closes at $100 and opens the next day at $90, the high − low range of the second day can be small even though the stock moved $10. True range includes that gap, so ATR reflects the full move.
How do traders use ATR for stop losses?
A common method places the stop a multiple of ATR away from the entry or the recent high, often 2 to 3 × ATR. The stop is then wider for volatile stocks and tighter for quiet ones, so normal day-to-day noise is less likely to trigger it.
What is a good ATR value?
There is no good or bad ATR. It is measured in dollars, so it depends on the share price. To compare stocks, divide ATR by the price: an ATR of $9 on a $143 stock is about 6.4% a day, while an ATR of $2 on a $100 stock is 2%.
Does a rising ATR mean the price will go up?
No. ATR rises when ranges get bigger, whether prices are rising or falling. Sharp sell-offs often push ATR higher than rallies do. Use trend indicators or the price itself to judge direction.