- What they are
- Formula
- Worked example
- vs Bollinger Bands
- Reading the chart
- Trading signals
- Settings
- Limitations
- FAQ
What are Keltner Channels?
The middle line is an exponential moving average, the trend. The outer lines are set a fixed number of Average True Ranges away from it, so the channel is as wide as the stock’s typical daily movement requires. On a quiet stock the channel is narrow; after a run of wide-range days or gaps it spreads out.
Chester Keltner described the original version in 1960, using a 10-day average of the typical price and the average high-low range. The modern form, popularized by Linda Bradford Raschke, swaps in an EMA and ATR, and that is what charting platforms show today.
Keltner Channel formula
Settings written (EMA length, multiplier, ATR length): (20, 2, 10) is a common default
The channel is always symmetric around the middle line, and its total width is 4 × ATR. ATR is in dollars, so the width is too.
Worked example: Oracle’s last bar
The chart below shows Keltner Channels (20, 2, 10) on Oracle (ORCL), ending with a bar that opened at $108.48, reached $108.99, fell to $100.25 and closed at $101.19, down $9.38 from the previous close of $110.57. The legend gives the three lines: 136.71, 120.73 and 104.75.
| Step | Calculation | Result |
|---|---|---|
| ATR (10) | (136.71 − 120.73) / 2 | $7.99 |
| Upper channel | 120.73 + 2 × 7.99 | $136.71 |
| Lower channel | 120.73 − 2 × 7.99 | $104.75 |
| Channel width | (136.71 − 104.75) / 120.73 | 26.5% of the middle line |
| Close vs lower channel | 101.19 − 104.75 | −$3.56, about 0.45 ATR below |
The middle line can be checked the same way. A 20-period EMA gives the newest close a weight of 2 / 21 ≈ 9.5%, so EMAtoday = EMAyesterday + 0.095 × (Close − EMAyesterday). Solving with the 120.73 reading puts the previous EMA at about $122.79: one close $21.60 below the average pulled it down by about $2.06. The day’s true range was |100.25 − 110.57| = $10.32, larger than the $8.74 high-low range because the stock never got back to the previous close.
Keltner Channels vs Bollinger Bands
| Keltner Channels | Bollinger Bands | |
|---|---|---|
| Middle line | 20-period EMA | 20-period SMA |
| Width set by | ATR: daily high-low range, including gaps | Standard deviation of closes |
| Shape | Smooth, changes width gradually | Bulges quickly after big closes, pinches in quiet markets |
| Typical use | Trend strength, breakouts, pullbacks to the middle line | Squeezes, mean reversion, %B |
Because standard deviation reacts to the squared size of moves, Bollinger Bands swing between very wide and very narrow, while Keltner Channels stay more even. Comparing the two is the basis of the squeeze signal described below.
Reading Keltner Channels on a chart: Oracle (ORCL)
The daily chart of Oracle Corporation (ORCL) below covers one year, with Keltner Channels (20, 2, 10) as the shaded envelope, the 10, 50 and 200-day SMAs and volume.
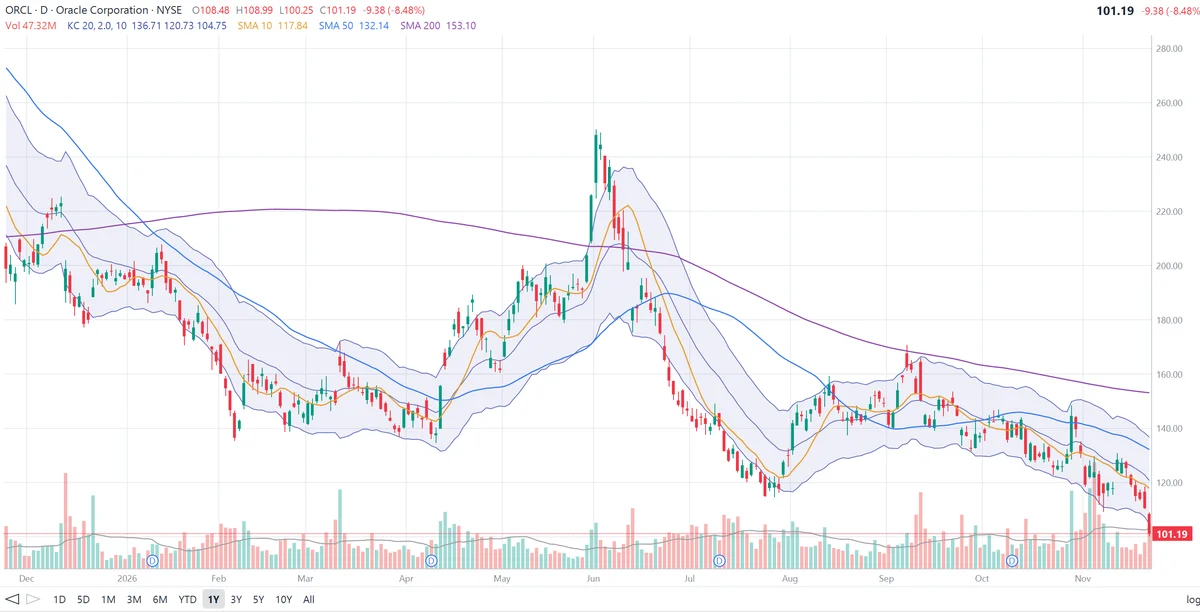
What the channel shows on this chart:
- A downtrend that kept to the lower half. From December to February Oracle fell from about $225 to about $137. Most bars stayed below the falling middle line, and the sharpest legs, in late December and early February, closed below the lower channel.
- A flat channel in March. As the selling stopped, the channel flattened between about $138 and $170. A spike to about $172 in early March reached the upper channel and faded, and dips to about $135 held near the lower channel. In a flat channel, the outer lines act as a range.
- The April breakout. In mid-April Oracle closed above the upper channel and then walked along it through May to about $200, with pullbacks stopping near the rising middle line, the classic pattern of a healthy uptrend.
- The June spike. At the start of June the stock jumped to about $250, far above the upper channel near $226. The channel widened to its widest of the year, with ATR (10) around $14, but a move that far outside the channel was not sustained.
- Riding the lower channel. From mid-June to late July Oracle fell from above $220 to about $115, hugging the lower channel for most of July. The middle line, then near $200 and falling, never came close to being retested.
- A sideways autumn. From August to October the channel ran roughly flat between about $130 and $160. The September high near $170 poked above the upper channel for only a few days.
- The latest move. After a failed rally to about $148 at the start of November, Oracle fell through the middle line and has now closed at $101.19, below the lower channel and below any close on this chart. The channel’s ATR has risen back to about $8, and price is under all three moving averages, 34% below the 200-day.
How traders use Keltner Channels
1. Breakouts
A close above the upper channel means price has moved more than two typical daily ranges above its average: strong demand. Trend followers buy those closes, or sell short below the lower channel, and exit when price closes back across the middle line.
2. Pullbacks to the middle line
In an established trend, the EMA is a natural place for pullbacks to end. Oracle’s May advance is an example: dips repeatedly held near the middle line while price kept returning to the upper channel.
3. Range trading
When the channel is flat, touches of the outer lines tend to reverse toward the middle, as in March and in the autumn on the Oracle chart. The slope of the middle line is the simplest way to tell a range from a trend.
4. The squeeze
John Carter’s TTM Squeeze plots Bollinger Bands together with Keltner Channels. When the Bollinger Bands contract inside the Keltner Channel, volatility is unusually low; when they expand back outside it, the squeeze “fires” and a larger move often follows. Like any squeeze signal, it does not give the direction.
5. Stops and targets
The opposite channel line or the middle line can serve as a stop, and because the channel is built from ATR, the distance is automatically adjusted to the stock’s volatility.
Keltner Channel settings
| Setting | Use |
|---|---|
| 20, 2, 10 (common default) | 20-day EMA, channel at 2 × the 10-day ATR |
| 20, 1.5, 10 or 20, 1.5, 20 | Narrower channel; used in squeeze setups and for earlier breakout signals |
| 20, 2.5 to 3 | Wider channel; fewer, stronger breakout signals |
| 50, 2 to 3 | Longer-term trends |
Platforms differ in their defaults. Some use the same length for the EMA and ATR, and some offer a simple moving average or a plain high-low range in place of ATR. Check the legend: Oracle’s chart shows (20, 2.0, 10).
Limitations of Keltner Channels
- Lag. Both the EMA and ATR are averages, so the channel catches up after sudden moves, as it did after Oracle’s June spike.
- Breakouts fail. Closes outside the channel often reverse in sideways markets; the same signal means different things in a trend and a range.
- Gaps widen the channel after the fact. A large gap raises ATR for days afterwards, which can make the channel too wide just as volatility returns to normal.
- Settings are not standard. Results depend on the EMA length, the ATR length and the multiplier, which vary between platforms.
- Not a prediction. Combine the channel with the trend, support and resistance, volume and fundamentals.
Frequently asked questions
What are Keltner Channels?
Keltner Channels are a volatility envelope drawn around price: a 20-period exponential moving average in the middle, with an upper and lower line set a multiple of the Average True Range (ATR) above and below it. The channel widens when daily ranges grow and narrows when they shrink.
How are Keltner Channels calculated?
Middle line = 20-period EMA of the close. Upper channel = middle line + 2 × ATR. Lower channel = middle line − 2 × ATR. A common default is a 20-period EMA, a 10-period ATR and a multiplier of 2, written (20, 2, 10).
What is the difference between Keltner Channels and Bollinger Bands?
Bollinger Bands use a simple moving average and the standard deviation of closing prices, so they react strongly to a few large closes. Keltner Channels use an EMA and ATR, which is based on the daily range including gaps, so the channel is smoother and changes width more gradually.
What does a close outside the Keltner Channel mean?
A close above the upper channel shows unusually strong buying compared with recent ranges, and a close below the lower channel shows unusually strong selling. Trend traders often treat these closes as breakouts; in a sideways market they more often mark stretched moves that return toward the middle line.
Who invented Keltner Channels?
Chester Keltner described the original version in 1960, using a 10-day average of the typical price and a band based on the average daily high-low range. Linda Bradford Raschke later popularized the modern version with an exponential moving average and the Average True Range.
What is the TTM Squeeze?
The squeeze, popularized by John Carter, compares Bollinger Bands with Keltner Channels. When the Bollinger Bands contract inside the Keltner Channel, volatility is unusually low; when they expand back outside it, the squeeze has fired and a larger move is often under way.