What are Bollinger Bands?
A simple moving average tells you the typical price over the last 20 days. Bollinger Bands add a second piece of information: how far prices usually stray from that average. The standard deviation measures that spread, and the bands are drawn two standard deviations on either side of the average.
Because the bands are built from recent volatility, “high” and “low” become relative. A close at the upper band means the stock is high compared with its own last 20 bars, not that it is overbought in any absolute sense. And because the bands widen and narrow, their width is an indicator in its own right: very narrow bands mark unusually quiet markets, which tend to be followed by larger moves.
Bollinger Bands formula
σ = population standard deviation of the same 20 closes (divide by n, not n − 1)
Two indicators come straight from the bands:
%B = 1 at the upper band, 0.5 at the middle, 0 at the lower band; above 1 or below 0 outside the bands
Worked example
The real bands use 20 closes. The steps are the same with fewer, so this example uses five: $20, $21, $22, $21 and $23.
| Close | Close − average | Squared |
|---|---|---|
| $20 | −1.4 | 1.96 |
| $21 | −0.4 | 0.16 |
| $22 | +0.6 | 0.36 |
| $21 | −0.4 | 0.16 |
| $23 | +1.6 | 2.56 |
| Step | Calculation | Result |
|---|---|---|
| Middle band | (20 + 21 + 22 + 21 + 23) / 5 | $21.40 |
| Standard deviation | √(5.20 / 5) = √1.04 | 1.02 |
| Upper band | 21.40 + 2 × 1.02 | $23.44 |
| Lower band | 21.40 − 2 × 1.02 | $19.36 |
| %B | (23 − 19.36) / (23.44 − 19.36) | 0.89 |
| Bandwidth | (23.44 − 19.36) / 21.40 | 19.1% |
The last close, $23, sits near the top of the bands (%B 0.89) but still inside them. If the next close were $25, both the average and the standard deviation would rise and the bands would widen to make room for the larger move.
Reading Bollinger Bands on a chart: Alcoa (AA)
The daily chart of Alcoa Corporation (AA) below covers one year. It shows Bollinger Bands (20, 2) as the shaded envelope, plus the 10, 50 and 200-day SMAs and volume.
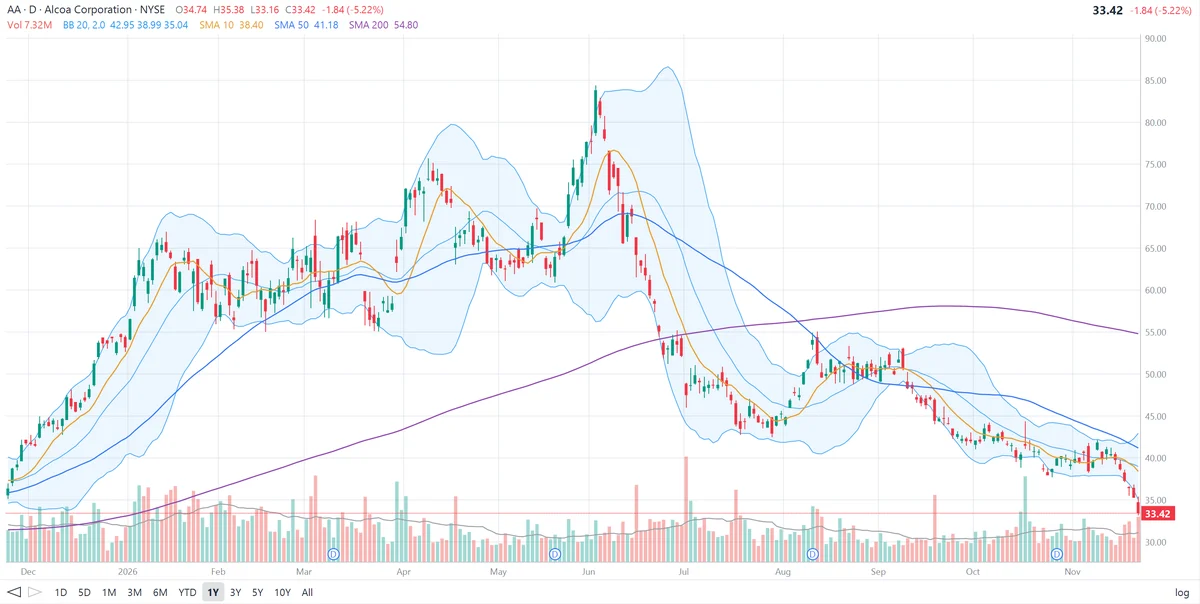
The legend is easy to check. The bands sit $3.96 above and $3.95 below the middle, so one standard deviation of the last 20 closes is about $1.98. %B = (33.42 − 35.04) / (42.95 − 35.04) = −0.20: the close is below the lower band. Bandwidth = (42.95 − 35.04) / 38.99 = 20.3%.
What the bands show on this chart:
- Walking the upper band. From early December to mid-January Alcoa climbed from about $36 to about $67, with candles pressing against or above the upper band most of the way. In a strong trend, touching the upper band is a sign of strength, not a sell signal. The bands widened to more than 40% of price in early January.
- A range with mean reversion. From late January to March the stock traded between about $55 and $68 and the bands flattened. Here the bands behaved as a range: the late-March dip to about $55 stopped at the lower band, and the April rally carried Alcoa to about $76 near the upper band.
- May squeeze and June breakout. In May the bands narrowed to roughly $60.50 and $69, a width of about 13%. At the start of June the stock broke out above the upper band and ran to about $84, its high for the year, with the upper band chasing it higher.
- Expansion on the way down. The reversal was just as fast. From mid-June to early July Alcoa fell from the $80s to about $47, riding the lower band. With the upper band still near $86 from the rally, the bands reached their widest of the year around the start of July, about 60% of price.
- Back inside the bands. Alcoa bottomed near $43 in late July and rebounded to about $55 in mid-August, where it met the upper band and the falling 50-day SMA.
- The September squeeze. In early September the bands closed in to about $49 and $53, a width of roughly 8%, the narrowest of the year. The squeeze resolved downward: Alcoa broke below the lower band in mid-September and walked it down to about $41 in October.
- The latest move. From late October to mid-November the bands narrowed again, to roughly $38 and $42.50 (about 11%). In the last few sessions Alcoa broke down, closing at $33.42, below the lower band and below any close on this one-year chart. Bandwidth has nearly doubled to 20.3%, and the upper band has turned up as the bands expand around the breakdown. Price is under all three moving averages.
How traders use Bollinger Bands
1. The squeeze
When Bandwidth falls to its lowest level in several months, volatility is unusually low, and low volatility tends to give way to high volatility. Traders wait for a close outside the bands to show the direction. Alcoa’s May squeeze broke up and its September squeeze broke down: the squeeze says a move is likely, not which way.
2. Walking the bands
In strong trends price closes at or beyond one band again and again, while the middle band acts as support (uptrend) or resistance (downtrend). Closes back across the middle band are the first sign the trend is weakening.
3. Mean reversion in ranges
When the bands are flat and the stock is moving sideways, touches of the outer bands often reverse toward the middle. Traders usually confirm with an oscillator such as RSI, because the same touch in a trending market means the opposite.
4. W-bottoms and M-tops
Bollinger described a W-bottom as a first low outside the lower band followed by a second, lower price low that holds inside the band (%B above 0). The weaker push at the second low is a form of divergence. An M-top is the mirror image at the upper band.
5. %B and Bandwidth as indicators
%B turns the bands into an oscillator that can be compared with other indicators or screened across many stocks; Bandwidth is the standard way to find squeezes.
Bollinger Band settings
| Setting | Use |
|---|---|
| 20, 2 (default) | Bollinger’s standard for daily charts; about one month of trading |
| 10, 1.9 | Shorter-term; tighter multiplier keeps a similar share of prices inside |
| 50, 2.1 | Longer-term trends; wider multiplier for the longer average |
Bollinger’s suggestion is to change the multiplier slightly when the length changes. Some platforms also offer an exponential middle band, but the standard bands use a simple moving average.
Limitations of Bollinger Bands
- A touch is not a signal. Closes at the bands mean opposite things in trends and in ranges; the bands alone cannot tell which you are in.
- Direction-neutral squeeze. A narrow band warns of a bigger move but says nothing about its direction, and false breakouts are common.
- Not a probability band. Prices are not normally distributed, so the familiar “95% within two standard deviations” does not hold reliably, and big moves outside the bands happen more often than that suggests.
- Lag. The bands are built from the last 20 closes, so they react after a sudden move, as the upper band did when Alcoa collapsed in June.
- Not a prediction. Combine the bands with the trend, support and resistance, volume and fundamentals.
Frequently asked questions
What are Bollinger Bands?
Bollinger Bands, developed by John Bollinger in the 1980s, are three lines drawn around price: a 20-period simple moving average in the middle, and upper and lower bands two standard deviations above and below it. The bands widen when prices are volatile and narrow when they are quiet.
How are Bollinger Bands calculated?
Middle band = 20-period simple moving average of the close. Upper band = middle band + 2 × the standard deviation of the same 20 closes. Lower band = middle band − 2 × that standard deviation. Bollinger uses the population standard deviation (dividing by n, not n − 1).
What does it mean when price closes outside the Bollinger Bands?
A close above the upper band or below the lower band means the move was unusually large compared with the last 20 bars. It is not a buy or sell signal on its own: in strong trends price can keep closing at or beyond one band for weeks, which is called walking the band.
What is a Bollinger Band squeeze?
A squeeze is a period when the bands are unusually close together, so Bandwidth is near its lowest level in months. Quiet periods tend to be followed by bigger moves, so traders watch for price to break out of the narrow bands. The squeeze does not tell you the direction of the breakout.
What are %B and Bandwidth?
%B shows where the close sits relative to the bands: (close − lower band) / (upper band − lower band). It is 1 at the upper band, 0 at the lower band, above 1 or below 0 outside them. Bandwidth is (upper band − lower band) / middle band, the width of the bands as a percentage of price.
What are the best Bollinger Band settings?
The standard setting is 20 periods and 2 standard deviations. Bollinger suggests 1.9 standard deviations with a 10-period average and 2.1 with a 50-period average, so the bands contain a similar share of prices when the length changes.