What does standard deviation measure?
Start with the 20-day simple moving average. Some closes were above it, some below. Standard deviation summarizes those distances in one number, in dollars. A stock whose closes all sat within a dollar or two of the average has a small standard deviation; a stock that swung $30 either side has a large one.
Two properties matter for reading it. First, it has no direction: a fast rally and a fast decline both push it up. Second, because the distances are squared, a few large moves raise it much more than many small ones. That makes standard deviation more sensitive to sudden moves than range-based measures such as the Average True Range.
Standard deviation formula
n = 20 by default. Dividing by n gives the population standard deviation (used by Bollinger Bands); dividing by n − 1 gives the sample version
In words: average the closes, measure each close’s distance from that average, square the distances, average the squares, and take the square root to get back to dollars.
Worked example
Five closes: $100, $102, $98, $104 and $96.
| Close | Close − average | Squared |
|---|---|---|
| $100 | 0 | 0 |
| $102 | +2 | 4 |
| $98 | −2 | 4 |
| $104 | +4 | 16 |
| $96 | −4 | 16 |
| Average $100 | Sum 40 |
| Version | Calculation | Result |
|---|---|---|
| Population (÷ n) | √(40 / 5) = √8 | $2.83 |
| Sample (÷ n − 1) | √(40 / 4) = √10 | $3.16 |
| ±2σ around the average | 100 ± 2 × 2.83 | $94.34 to $105.66 |
The ±2σ range is exactly what Bollinger Bands draw. Notice how the squared distances work: the two closes $4 away contribute 32 of the 40, eight times as much as the two closes $2 away. Doubling a move quadruples its weight.
Reading standard deviation on a chart: GE Aerospace (GE)
The daily chart of GE Aerospace (GE) below covers one year. The upper panel shows price with the 10, 50 and 200-day SMAs and volume; the lower panel shows the 20-day standard deviation of the close.
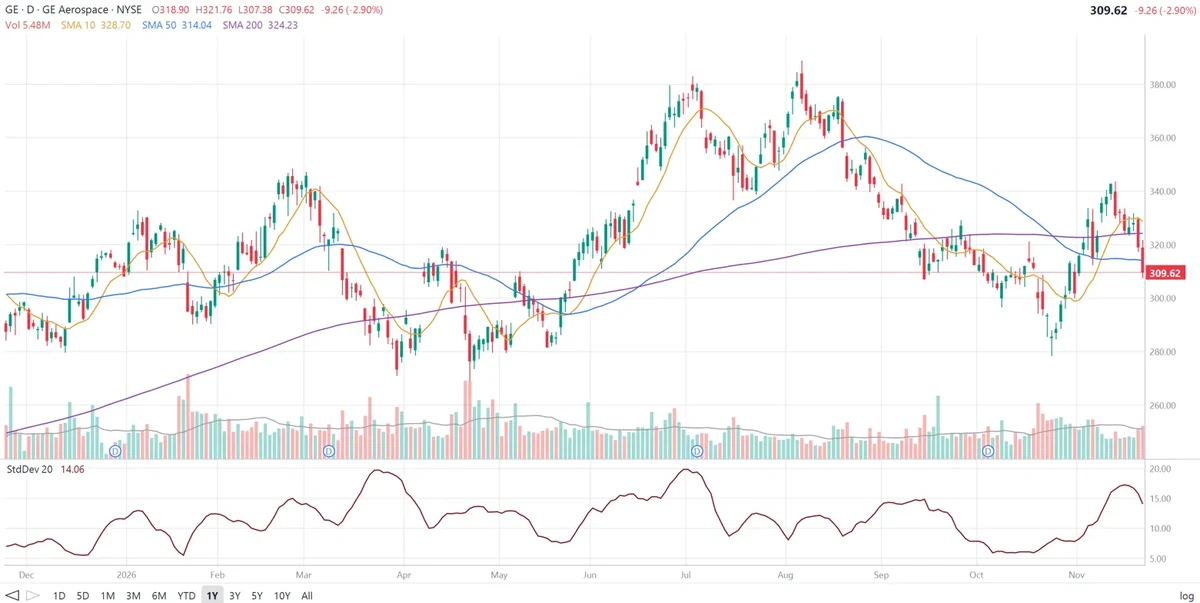
A reading of 14.06 means GE’s last 20 closes have typically been about $14 from their 20-day average. Bollinger Bands (20, 2) on this chart would sit 2 × 14.06 = $28.12 either side of that average, a band about $56 wide.
What standard deviation shows on this chart:
- Volatility comes in waves. Over the year the line swung between about 6 and about 20 again and again. Calm spells rarely lasted more than a few weeks, and neither did volatile ones.
- A spike from a decline. In March GE fell from about $347 to about $273. Standard deviation climbed to about 20 in late March, one of its two highest readings of the year.
- An equal spike from a rally. In June GE rallied from about $290 to about $383 by the start of July, and standard deviation reached about 20 again. The two peaks look identical even though one came from a sell-off and the other from a rally: standard deviation measures how far prices moved, not which way.
- New highs on lower volatility. In early August GE made its high for the year near $389, yet standard deviation peaked at only about 12. The climb back to the high was more gradual than the June surge.
- Quiet before the storm. Standard deviation fell to about 8 in late May, just before the June rally, and to about 6 in October, the lowest since January, while GE drifted between about $305 and $320. Both quiet spells were followed by big moves: in October, a drop to about $279 and then a rally to about $343 by mid-November, which lifted standard deviation to about 17.
- The latest reading. GE has fallen back from about $343 to $309.62 and standard deviation has turned down from about 17 to 14.06. The large late-October and early-November moves are still inside the 20-day window; as they drop out, the reading will fall unless new large moves replace them. Price is below all three moving averages.
How traders use standard deviation
1. Volatility cycles
Periods of unusually low standard deviation tend to be followed by expansion. Traders look for the reading to reach its lowest level in several months, then wait for price to show direction. This is the same idea as the Bollinger Band squeeze, since band width is 4σ.
2. Confirming moves
A breakout accompanied by rising standard deviation shows prices are moving decisively away from their average. A breakout with flat or falling standard deviation is more likely to be a drift than a real change.
3. Stops and position size
Like ATR, standard deviation can set stop distances (for example, two standard deviations from entry) and scale position size so that volatile stocks get smaller positions.
4. Z-score
Dividing a close’s distance from the average by the standard deviation gives a z-score: how many standard deviations away price is. A z-score of +2 is the upper Bollinger Band; mean-reversion traders use extreme z-scores to look for stretched moves in range-bound markets.
Standard deviation settings
| Period | Use |
|---|---|
| 10 | Short-term; reacts within days to new volatility |
| 20 (default) | About a month; matches Bollinger Bands |
| 50 to 100 | Longer-term volatility regime |
Check whether your platform uses the population or the sample formula. The difference is small with 20 bars (the sample value is about 2.6% higher) but matters with short periods.
Limitations of standard deviation
- No direction. Rallies and sell-offs raise it equally, as GE’s March and June peaks show.
- In dollars. It scales with the share price, so compare stocks by dividing by price, or use historical volatility based on percentage returns.
- Trends inflate it. A steady one-way move pulls closes far from the average even if daily swings are small, so a high reading does not always mean choppy trading.
- Drop-off effect. A single big day raises the reading for exactly 20 bars and then disappears from it all at once, which can make the line jump without anything happening that day.
- Not a prediction. Combine it with the trend, support and resistance, volume and fundamentals.
Frequently asked questions
What is the standard deviation indicator?
The standard deviation indicator measures how widely closing prices have spread around their average over the last n bars, usually 20. It is in price units: a 20-day standard deviation of 14 means closes have typically been about $14 away from their 20-day average. High values mean volatile prices; low values mean quiet ones.
How is standard deviation calculated?
Take the average of the last n closes. Subtract the average from each close, square each difference, add the squares, divide by n, and take the square root. Dividing by n gives the population standard deviation used by Bollinger Bands; dividing by n − 1 gives the sample version, which is slightly larger.
What does a high standard deviation mean for a stock?
It means closing prices have been far from their recent average, either because the stock moved sharply in one direction or because it swung back and forth. It does not say which direction; strong rallies raise standard deviation as much as sell-offs do.
What does a low standard deviation mean?
A low reading means prices have stayed close to their average, a quiet market. Volatility tends to move in cycles, so unusually low standard deviation is often followed by a larger move, which is the idea behind the Bollinger Band squeeze.
What is the difference between standard deviation and ATR?
Standard deviation measures how far closing prices are from their average and is not affected by gaps or intraday ranges directly. The Average True Range measures the average size of each bar’s range, including gaps from the previous close. Both are in price units and both rise when markets get more volatile.
Is the standard deviation indicator the same as historical volatility?
Not quite. The chart indicator measures the spread of prices in dollars. Historical volatility measures the standard deviation of daily percentage (usually logarithmic) returns, and is often annualized by multiplying by the square root of 252 trading days, so it can be compared across stocks.