What are Donchian Channels?
Most channels are built from averages and volatility. Donchian Channels use nothing but the extremes: the upper line is the highest price of the lookback period and the lower line is the lowest. Price can never close outside the channel when the current bar is included; instead, a breakout shows up as the upper line stepping up to a new high or the lower line stepping down to a new low.
Because no averaging is involved, the lines run flat and then jump. A line moves for only two reasons: price makes a new extreme, or the old extreme becomes more than 20 bars old and drops out of the window. Reading which of the two happened is most of the skill.
Donchian Channel formula
n = 20 by default. Breakout systems usually compare today’s price with the channel of the previous n bars, excluding today
Worked example
With a 5-bar channel instead of 20, six days of highs and lows look like this:
| Day | High | Low |
|---|---|---|
| 1 | $10.40 | $9.80 |
| 2 | $10.60 | $10.00 |
| 3 | $10.50 | $10.10 |
| 4 | $10.90 | $10.30 |
| 5 | $10.70 | $10.20 |
| 6 | $11.20 | $10.60 |
| Day | Window | Upper | Lower | Middle |
|---|---|---|---|---|
| 5 | Days 1–5 | $10.90 (day 4) | $9.80 (day 1) | $10.35 |
| 6 | Days 2–6 | $11.20 (day 6, new high) | $10.00 (day 2) | $10.60 |
On day 6 both lines moved, for different reasons. The upper line rose because day 6 made a new 5-day high above $10.90, a breakout. The lower line rose because day 1’s $9.80 low dropped out of the window, even though no new low was made. A breakout trader comparing day 6 with the previous channel (days 1–5) sees a high of $11.20 above $10.90 and gets a buy signal.
Reading Donchian Channels on a chart: Nu Holdings (NU)
The daily chart of Nu Holdings (NU) below covers one year, with a 20-day Donchian Channel as the shaded area, the 10, 50 and 200-day SMAs and volume.
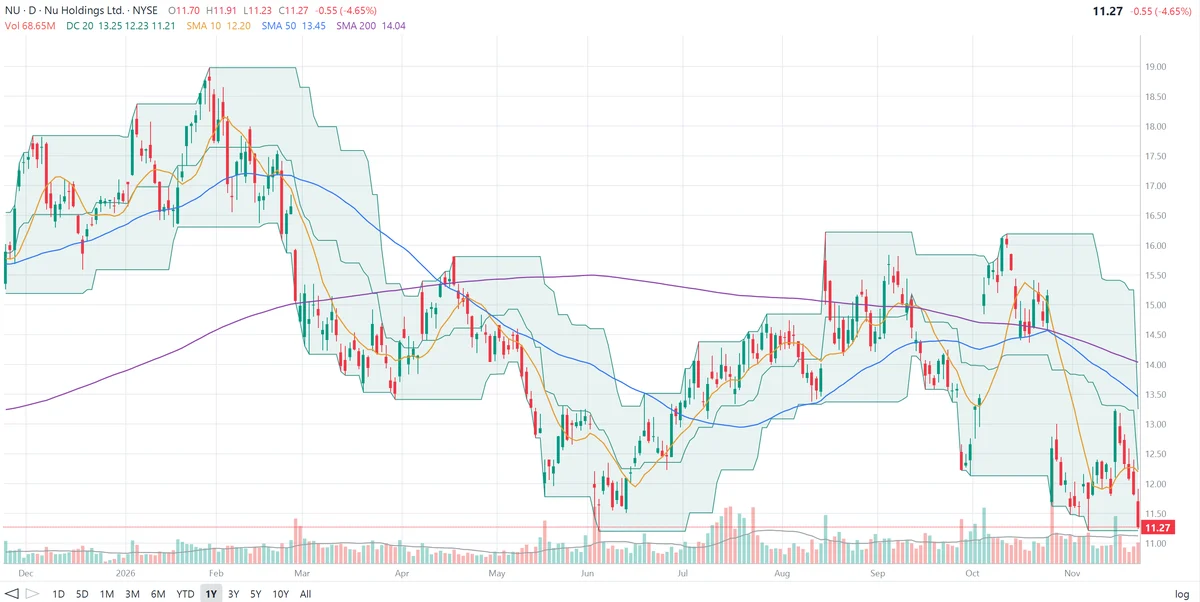
The legend checks out: (13.25 + 11.21) / 2 = 12.23. The channel is $2.04 wide, 16.7% of the middle line, and the close sits only $0.06 above the 20-day low, near the bottom 3% of the range. The day’s low of $11.23 came within two cents of the $11.21 low from early November but did not break it.
What the channel shows on this chart:
- A stair-step uptrend. From December to late January the upper line stepped up from about $17.85 to about $18.40 and then to about $19.00, the high for the year, as Nu kept making new 20-day highs. The lower line followed from about $15.20 to about $16.30. In a healthy uptrend both lines rise and price spends most of its time in the upper half.
- The late-February break. Nu fell through the $16.30 lower line in late February, a new 20-day low and the signal a breakout trader would use to exit the long. The lower line stepped down to about $14.20 in early March and $13.50 by late March.
- A sideways channel. From late March to early May the lines went flat at roughly $13.40 and $15.80. With no new highs or lows, there were no breakout signals; the stock just moved inside the range.
- The May–June breakdown. In mid-May Nu broke below $13.40 and the lower line fell in quick steps to about $11.80, then to about $11.21 in early June, the low for the year.
- The summer climb. From June to mid-August the upper line stepped up repeatedly, from about $13.30 to $13.90, $14.40, $14.85 and finally about $16.20 in mid-August. Each step was a new 20-day high, and the lower line trailed up to about $13.40.
- A double top. After a drop to about $12.15 in late September, Nu rallied to a new 20-day high of about $16.20 in early October, matching the August high, but could not go further. In late October the stock fell sharply and the lower line fell to $11.21 in early November.
- The latest reading. A bounce in mid-November reached $13.25, now the top of the channel as the October highs have dropped out of the window. Nu then fell back to $11.27, just above the lower line and roughly at the June low. A close below $11.21 would be a new 20-day low and a break of the year’s low area; holding above it would leave a possible double bottom. Price is below all three moving averages.
How traders use Donchian Channels
1. Breakouts
The classic rule: buy when price exceeds the highest high of the previous 20 bars, sell or sell short when it falls below the lowest low. Richard Donchian’s original four-week rule worked this way, and the Turtle traders made it famous in the 1980s.
2. The Turtle rules
| System | Entry | Exit |
|---|---|---|
| System 1 | 20-day breakout | 10-day breakout in the opposite direction |
| System 2 | 55-day breakout | 20-day breakout in the opposite direction |
The shorter exit channel lets a trend run while cutting the trade once the move fades. The Turtles sized positions with ATR, which they called N, and placed stops at 2N from the entry.
3. Trailing stops
The lower line of a shorter channel is a natural trailing stop for a long position, and the upper line for a short. It only moves in the direction of the trade until a new extreme is made against it.
4. Trend and range
Rising steps in both lines mark an uptrend; falling steps mark a downtrend. Long flat stretches, like Nu’s from late March to early May, mark a range where breakout signals are rare and other tools such as oscillators work better.
Donchian Channel settings
| Period | Use |
|---|---|
| 10 | Short-term exits and trailing stops |
| 20 (default) | About four weeks of trading: Donchian’s four-week rule, Turtle System 1 entry |
| 55 | Turtle System 2 entry; fewer, longer-term signals |
Many traders plot two channels at once, such as 20 and 10 days, to show entry and exit levels together.
Limitations of Donchian Channels
- Many false breakouts. In a range, price often pokes one cent beyond the channel and reverses. Trend-following systems accept many small losses in exchange for occasional large trends.
- One bar can set the line for 20 days. A single spike, like a gap or an earnings move, holds the upper or lower line in place until it drops out of the window.
- Late exits. The lower line can be far below price after a strong run, so a trailing exit may give back a large part of the move.
- Including today or not. Platforms differ; if the current bar is included, price can touch but never close outside the channel, so breakout rules need to use the previous bar’s channel.
- Not a prediction. Combine the channel with the trend, support and resistance, volume and fundamentals.
Frequently asked questions
What are Donchian Channels?
Donchian Channels plot the highest high and the lowest low of the last n bars, usually 20, with a middle line halfway between them. The channel shows the trading range of the period: a new 20-day high pushes the upper line up, and a new 20-day low pushes the lower line down.
How are Donchian Channels calculated?
Upper channel = highest high of the last n bars. Lower channel = lowest low of the last n bars. Middle line = (upper + lower) / 2. No averaging or smoothing is involved, which is why the lines move in flat steps.
Who created Donchian Channels?
Richard Donchian, a pioneer of trend-following futures funds, developed them. His best-known rule, the four-week rule, bought when price exceeded the high of the previous four weeks and sold when it fell below the low of the previous four weeks.
What are the Turtle trading rules?
The Turtles, traders trained by Richard Dennis and William Eckhardt in the 1980s, used Donchian breakouts. One system entered on a 20-day breakout and exited on a 10-day breakout in the opposite direction; a second entered on a 55-day breakout and exited on a 20-day breakout.
Why are Donchian Channel lines flat?
The lines only change when a new high or low is made, or when an old high or low drops out of the lookback window. Between those events the highest high and lowest low stay the same, so the lines run flat and then step up or down.
What is the difference between Donchian and Keltner Channels?
Donchian Channels use only the highest high and lowest low of the period, so they mark actual price extremes. Keltner Channels set their lines a multiple of the Average True Range around an exponential moving average, so they move smoothly and measure typical daily volatility instead of extremes.