What are pivot points?
The central pivot is simply the average of the last period’s high, low and close: a rough “fair value” of where the market spent its time. The other levels step out from it by amounts based on the last period’s range. A wide range last month means widely spaced levels this month; a quiet month means tight ones.
Unlike moving averages, pivot points do not move during the period. They are calculated once, at the start of the day, week or month, and then stay put, which is exactly why traders like them: everyone using the same data sees the same levels before the period begins.
Pivot point formula (classic)
High, low and close of the previous day, week or month. Some platforms define R3/S3 as P ± 2(High − Low)
Worked example
Last month a stock traded between $100 and $110 and closed at $106.
| Level | Calculation | Value |
|---|---|---|
| R3 | 110 + 2 × (105.33 − 100) | $120.67 |
| R2 | 105.33 + 10 | $115.33 |
| R1 | 2 × 105.33 − 100 | $110.67 |
| P | (110 + 100 + 106) / 3 | $105.33 |
| S1 | 2 × 105.33 − 110 | $100.67 |
| S2 | 105.33 − 10 | $95.33 |
| S3 | 100 − 2 × (110 − 105.33) | $90.67 |
R1 and S1 sit near last month’s high and low ($110.67 vs $110, $100.67 vs $100), shifted toward the side where the close landed. R2 and S2 are one full previous range ($10) from the pivot, and R3 and S3 mark moves well beyond last month’s range.
Reading pivot points on a chart: Walmart (WMT)
The daily chart of Walmart (WMT) below covers one year with classic monthly pivots. Each month has its own set of horizontal lines, calculated from the previous month: orange for P and the resistance levels, green for the support levels. Levels far from price are off the edges of the chart.
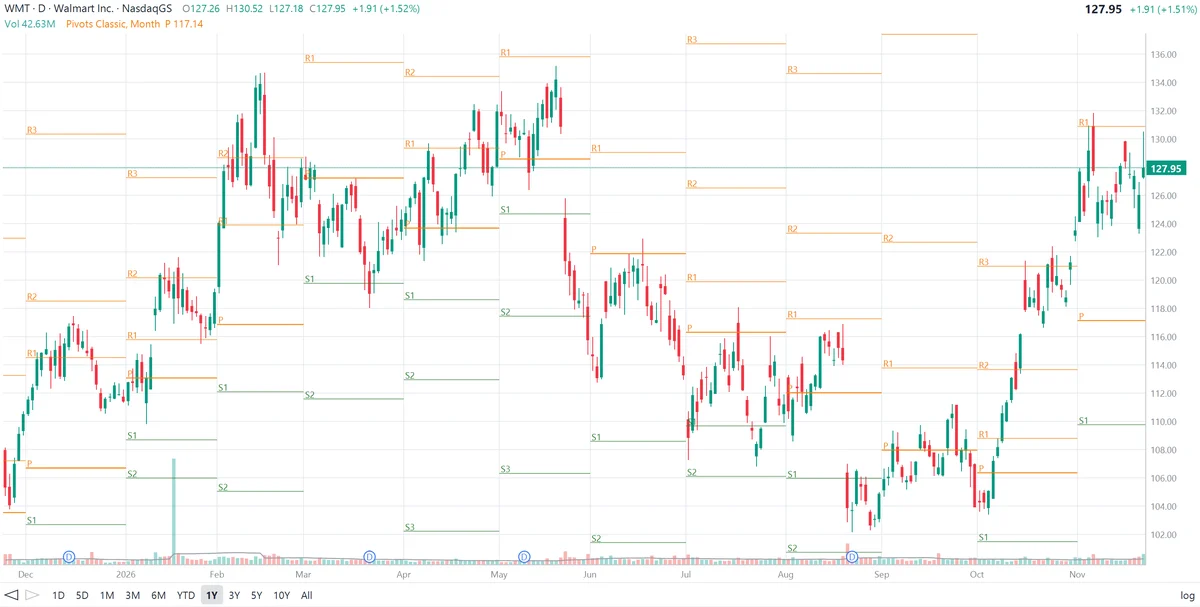
The legend gives November’s pivot, $117.14, and the chart places R1 near $130.88 and S1 near $109.77. Working the classic formulas backwards gives October’s high, low and close at about $124.51, $103.40 and $123.51: October was a big month, a rally of roughly 20% from its low that closed near its high. That wide range is why November’s levels are so far apart; R2 (about $138.25) and S2 (about $96.03) are off the chart.
What the pivots show on this chart:
- February: running through resistance. Walmart opened February just above its pivot of about $117, broke above R1 near $124 and R2 near $128.60 within days, and reached about $134.60. When price runs through R1 and R2 early in the period, the pivots are describing a trend, not a range.
- March: below the pivot. March’s pivot sat near $127. The stock spent most of the month below it and dropped to about $118 around March 20, briefly below S1 near $119.80, before bouncing. Trading below P all month marked the sellers’ month.
- August: down to the support levels. August’s pivot was about $112. Walmart fell below it and slid to about $102 in mid-August, between S1 (about $106) and S2 (about $100.70), and finished the month back near S1.
- October: P to R3 in one month. October’s levels were tight after a quiet September: P about $106.40, R1 $108.80, R2 $113.70 and R3 about $121. After an early dip to about $103.40, Walmart broke R1, then R2, and reached the R3 area in late October. Few months go from below the pivot to R3.
- November: above the pivot, capped at R1. Walmart has traded above November’s $117.14 pivot all month, 9% above it at the close, which keeps the monthly bias with buyers. But R1 near $130.88 has capped every rally so far: the stock pushed into the high $131s once early in the month and turned back, and the latest bar reached $130.52, just below R1, before closing at $127.95.
How traders use pivot points
1. Bias for the period
Trading above P favours buyers, below P favours sellers. Many day traders only take long trades above the daily pivot and short trades below it.
2. Support and resistance
R1 and S1 are the first levels where a move often pauses. A bounce off S1 or a rejection at R1, like Walmart’s at November’s R1, can be used for entries and exits with a stop just beyond the level.
3. Breakouts
A strong close through R1 or S1, especially early in the period, points to a trending period in which R2 and R3, or S2 and S3, become the targets, as in Walmart’s February and October.
4. Time frames
| Pivots | Calculated from | Typical chart |
|---|---|---|
| Daily | Previous day | 1 to 15-minute bars |
| Weekly | Previous week | Hourly or daily bars |
| Monthly | Previous month | Daily bars |
Levels from a higher time frame carry more weight: a daily pivot that lines up with a weekly or monthly level is watched by more traders.
Types of pivot points
| Type | How it differs |
|---|---|
| Classic (floor) | The formulas above; the most widely used |
| Fibonacci | Same P; levels at P ± 0.382, 0.618 and 1.000 × the previous range |
| Woodie | P = (High + Low + 2 × Close) / 4, giving the close more weight |
| Camarilla | Tighter levels around the previous close, based on fractions of the range |
| DeMark | P depends on whether the previous period closed up, down or unchanged |
Fibonacci pivots use the same ratios as Fibonacci retracement, but apply them to the previous period’s range rather than to a chosen price swing.
Limitations of pivot points
- Static levels. They ignore everything that happened before the previous period and do not adapt within the current one.
- Strong trends run through them. In months like Walmart’s February and October, pivot levels were broken one after another.
- Data choices matter. Results differ with or without extended-hours trading, and for daily pivots on markets that trade around the clock.
- Many variants. Classic, Fibonacci, Woodie and Camarilla levels differ, and so do platform definitions of R3 and S3.
- Not a prediction. Combine pivots with the trend, volume and other support and resistance.
Frequently asked questions
What are pivot points?
Pivot points are price levels calculated from the previous period’s high, low and close. The central pivot (P) is their average, and the resistance levels R1, R2, R3 above it and support levels S1, S2, S3 below it are projected from the pivot and the previous range. The levels stay fixed for the whole current period.
How are pivot points calculated?
Classic (floor) pivots: P = (high + low + close) / 3. R1 = 2P − low, S1 = 2P − high. R2 = P + (high − low), S2 = P − (high − low). R3 = high + 2 × (P − low), S3 = low − 2 × (high − P). High, low and close are from the previous day, week or month.
Which time frame should I use for pivot points?
Day traders use daily pivots, calculated from the previous day’s prices. Swing traders use weekly pivots from the previous week, and position traders use monthly pivots from the previous month. Longer time frames give wider, slower-changing levels.
Is price above the pivot point bullish?
Many traders treat trading above the central pivot as a sign that buyers are in control for the period and trading below it as a sign that sellers are. It is a simple bias filter, not a signal on its own.
What are the different types of pivot points?
Besides classic (floor) pivots, common variants include Fibonacci pivots, which space the levels at 38.2%, 61.8% and 100% of the previous range; Woodie pivots, which weight the close more heavily; Camarilla pivots, which place tighter levels around the previous close; and DeMark pivots, which depend on whether the previous period closed up or down.
Why do pivot points work?
Pivot points have no predictive power of their own, but they are widely used, simple to calculate and identical for everyone using the same data. Because many traders and algorithms watch the same levels, orders tend to cluster around them, which can make them act as support and resistance.