- What it is
- Formula
- Worked example
- Reading the chart
- How traders use it
- Anchored VWAP
- Limitations
- FAQ
What is VWAP?
Suppose a stock trades 1 million shares at $100 in the morning and only 100,000 shares at $110 in the afternoon. A simple average of the two prices is $105, but almost everyone who traded that day paid close to $100. VWAP reflects that: it weights each price by its volume, so it lands near $100.91, where the volume actually was.
Because it answers “what was the average price paid today?”, VWAP is used in two ways. Large funds use it as a yardstick: buying below the day’s VWAP or selling above it counts as good execution, and many orders are worked to track it. Short-term traders use it as a dividing line for the session’s trend, and as a level where pullbacks often stall.
VWAP formula
Both sums run from the first bar of the session; the calculation restarts at the next open
VWAP has no length setting. Early in the day it moves quickly, because each new bar is a large share of the total; by the afternoon it barely moves, because a single bar is a small share of a full day’s volume.
Worked example: four 30-minute bars
| Bar | Typical price | Volume | VWAP |
|---|---|---|---|
| 1 | $100 | 50k | $100.00 |
| 2 | $101 | 30k | $100.38 |
| 3 | $98 | 70k | $99.27 |
| 4 | $98 | 20k | $99.12 |
Each VWAP is the running sum of price × volume divided by the running sum of volume. After bar 2: (100 × 50k + 101 × 30k) / 80k = 8,030k / 80k = $100.38. After bar 4: 16,850k / 170k = $99.12.
A plain average of the four typical prices is $99.25. VWAP ends lower, at $99.12, because the heaviest bar, 70,000 shares, traded at $98. Bar 4 traded at the same $98 but on light volume, so it moved VWAP only 15 cents.
Reading VWAP on a chart: Meta Platforms (META)
VWAP belongs on intraday charts. The chart below shows Meta Platforms (META) in 30-minute bars over one month, with the session VWAP in purple. Each trading day the line starts again at the first bar, which is why it jumps at every open and forms separate curves for each session.
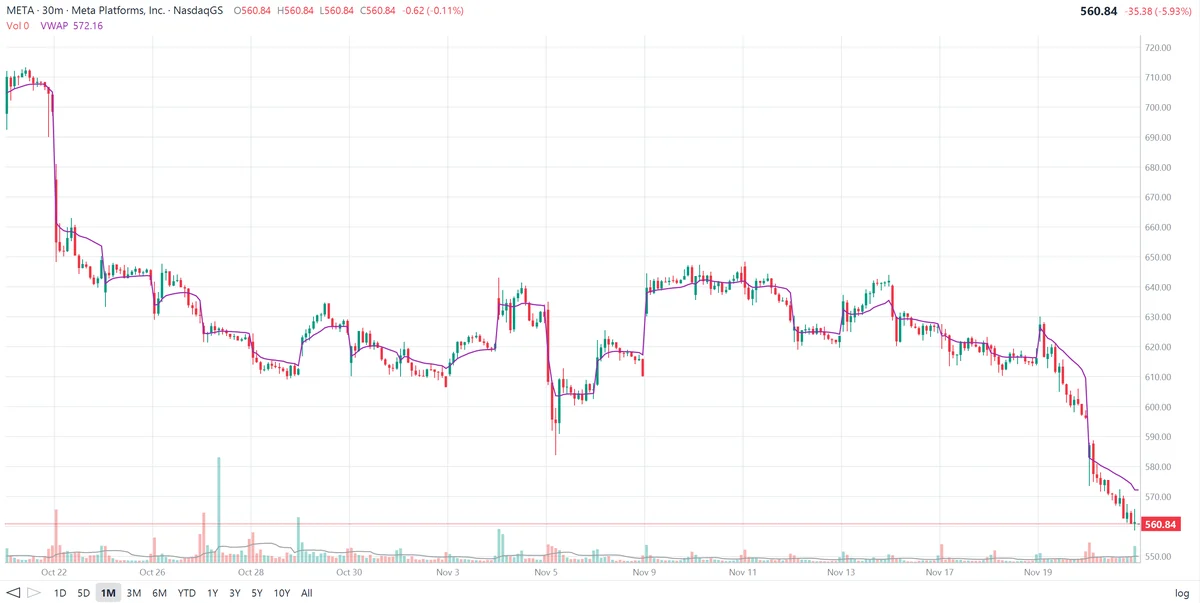
The final 30-minute bar in the legend shows zero volume with open, high, low and close all at $560.84: it is the closing price print, so it does not change VWAP. The session’s VWAP is $572.16, and the stock finished $11.32 below it, down $35.38 on the day.
What VWAP shows on this chart:
- A gap leaves VWAP behind. On October 22 Meta dropped from about $705 to below $650 at the open. That session’s VWAP started near the new lower prices, so it had nothing to do with the previous day’s levels: VWAP only knows about trades since today’s open.
- Weak sessions stay under VWAP. In the days after the drop, Meta drifted from about $645 to about $610 by October 29. On many of those days the stock spent the afternoon below that day’s VWAP, and rallies toward the line were sold.
- Strong sessions hold above it. From November 9 to 11 Meta gapped up to about $640 and traded between about $638 and $649. Price stayed mostly above a flat or rising VWAP, with dips buyers stepped into near the line.
- A sharp reversal day. On November 5 Meta fell to about $585, well below VWAP, before recovering to about $605. Big intraday swings pull VWAP along only slowly, because the volume already traded keeps it anchored to earlier prices.
- The last two sessions. On November 19 Meta opened with a spike to about $630, then slipped below VWAP and stayed there, closing near $596. On the final day it opened lower, near $588, and fell all session. VWAP started near $583 and slid to $572.16, but price never got back to it; every bounce stalled below the line, and the stock closed at $560.84, near the day’s low. A session that opens below VWAP’s path and never reclaims it is the textbook intraday downtrend.
How traders use VWAP
1. Intraday trend filter
Above a rising VWAP, day traders look for long trades; below a falling VWAP, for shorts. Many simply avoid buying a stock that is trading below its VWAP.
2. Pullback level
In a strong session, the first pullback to VWAP is a common entry. In a weak session, like Meta’s last day on the chart, rallies up to VWAP are where sellers tend to reappear.
3. Execution benchmark
Institutions measure fills against VWAP: buying below it, or selling above it, beats the day’s average. Algorithms that split large orders across the day often aim to match VWAP, which adds volume near the line.
4. VWAP bands
Many platforms add bands one, two or three volume-weighted standard deviations from VWAP. Like Bollinger Bands, the outer bands mark stretched moves away from the day’s average.
Anchored VWAP
Standard VWAP always starts at the session open. Anchored VWAP starts from a bar the trader chooses: an earnings gap, a major high or low, the first day of a trend, or the start of a quarter. It then shows the average price paid by everyone who has traded since that event, and can be used on daily and weekly charts where a session VWAP makes no sense.
| Version | Starts at | Typical chart |
|---|---|---|
| Session VWAP | Each day’s open | 1 to 30-minute bars |
| Weekly or monthly VWAP | Start of the week or month | Hourly or daily bars |
| Anchored VWAP | Any chosen bar (earnings, a high or low) | Daily or weekly bars |
On the Meta chart, a VWAP anchored at the October 22 gap would show the average price paid by everyone who bought or sold since the drop, a level many traders would watch as resistance on rallies.
Limitations of VWAP
- Intraday only. Session VWAP resets every day, so on a daily chart it is just the day’s average price and carries no trend information.
- Lags late in the day. After hours of volume, new bars barely move it, so VWAP reacts slowly to afternoon reversals.
- Extended hours. Platforms differ on whether pre-market and after-hours trades are included, which changes the value.
- Self-fulfilling, not predictive. VWAP matters partly because so many traders and algorithms watch it; it does not forecast where price will go.
- Not a prediction. Combine it with the daily trend, support and resistance and news.
Frequently asked questions
What is VWAP?
VWAP, the volume-weighted average price, is the average price a stock has traded at during the session, weighted by how many shares traded at each price. It starts fresh at the open each day and is plotted as a line on intraday charts. Price above VWAP means the average buyer of the day is in profit; price below means the average buyer is at a loss.
How is VWAP calculated?
For each bar, multiply the typical price, (high + low + close) / 3, by the bar’s volume. Add those products from the start of the session and divide by the total volume traded so far. VWAP = Σ (typical price × volume) / Σ volume.
Why does VWAP reset every day?
VWAP measures the average price paid during one trading session, which is how institutions judge whether an order was filled at a good price. Starting the sum again at each open keeps it focused on the current day. Versions that start from another chosen point are called anchored VWAP.
What does it mean when a stock is trading below VWAP?
It means the stock is below the average price paid by everyone who traded it that day, so sellers have had the upper hand. Day traders often treat a stock that stays below a falling VWAP as weak, and a stock that holds above a rising VWAP as strong.
What is the difference between VWAP and a moving average?
A moving average gives every bar the same weight and rolls forward over a fixed number of bars. VWAP weights each price by its volume, so heavily traded prices count more, and it accumulates from the session open instead of using a rolling window.
What is anchored VWAP?
Anchored VWAP starts the calculation from a chosen bar instead of the session open, such as an earnings day, a major high or low, or the start of a year. It shows the average price paid by everyone who has traded since that event, which many traders use as support or resistance on daily charts.