What is Chaikin Money Flow?
The idea behind CMF is that the close tells you who won the day. A stock that trades between $50 and $52 and closes at $51.90 finished near its high: buyers were in control at the end. The same range with a close at $50.10 means sellers were. CMF turns that position into a number between −1 (close at the low) and +1 (close at the high), multiplies it by the day’s volume, and averages over 20 days.
Unlike On-Balance Volume and the Money Flow Index, CMF does not compare today with yesterday. A stock can gap down, close lower than the day before and still add positive money flow if it closed near the top of its own range. That makes CMF sensitive to intraday buying and selling rather than to day-to-day direction.
Chaikin Money Flow formula
Multiplier = +1 when the close is at the high, 0 at the midpoint, −1 at the low
Worked example
A 3-period CMF (the real indicator uses 20), with volumes of 1,000, 1,500 and 1,200 shares:
| Day | Low–High | Close | Mult. | MF vol. |
|---|---|---|---|---|
| 1 | 50–52 | 51.50 | +0.50 | +500 |
| 2 | 51–53 | 51.40 | −0.60 | −900 |
| 3 | 51.50–52.50 | 52.40 | +0.80 | +960 |
Day 1’s multiplier is ((51.50 − 50) − (52 − 51.50)) / 2 = 0.50. Over the three days, money flow volume sums to 500 − 900 + 960 = 560 shares and volume to 3,700, so CMF = 560 / 3,700 = +0.15. Day 2 had the most volume, but days 1 and 3 closed high in their ranges and outweighed it.
Reading CMF on a chart: Agilent Technologies (A)
The daily chart of Agilent Technologies (A) below covers one year, with volume in the upper panel and CMF (20) in the lower panel.
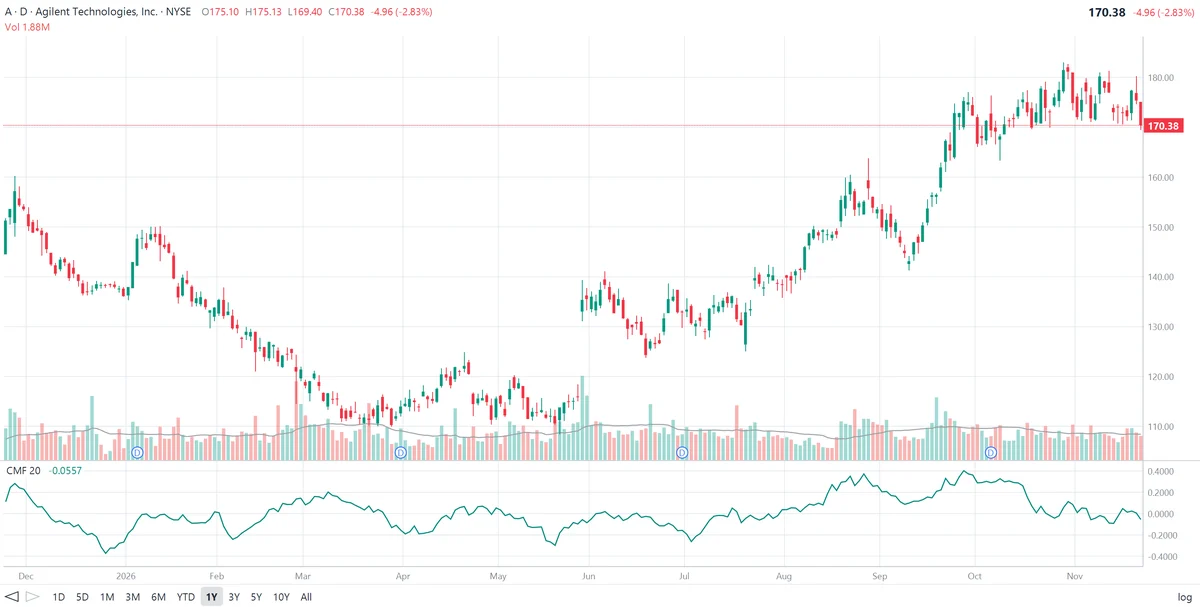
The last bar ranged from $175.13 to $169.40 and closed at $170.38, near the bottom. Its multiplier is ((170.38 − 169.40) − (175.13 − 170.38)) / (175.13 − 169.40) = −0.66, so about 1.24 million of the day’s 1.88 million shares count as selling pressure. A CMF of −0.0557 means that over 20 days, money flow volume was slightly negative: roughly balanced, leaning to distribution.
What CMF shows on this chart:
- Distribution in December. Agilent fell from about $160 at the start of December to about $137 by late in the month, mostly with closes near the day’s lows. CMF dropped to about −0.36, its lowest reading on the chart.
- Buying into the decline. From mid-February to mid-March the stock kept falling, from about $135 toward $120, yet CMF rose from about −0.15 to about +0.2. Closes were landing in the upper part of the daily ranges on heavy volume: buyers were absorbing the selling. Price still slipped to about $111 by early April, a reminder that divergence is not timing.
- Weak volume before the gap. In late May, with Agilent near its lows around $111 to $115, CMF fell to about −0.29. At the start of June the stock gapped up to about $135 on one of the heaviest volume days of the year, and CMF moved back to around zero.
- Accumulation in the advance. From August CMF climbed steadily to about +0.38 as Agilent rallied to about $160. During the September pullback to about $142, CMF stayed positive, around +0.1: the dip came without real distribution. The stock then broke out to the $170s in late September, with CMF at its high of the year, about +0.4.
- A bearish divergence at the top. In late October and early November Agilent made new highs near $183, but CMF fell from about +0.3 to near zero and has hovered between about −0.08 and +0.06 since. Price was at its high; money flow had gone neutral.
- The latest reading. With the last bar closing near its low on 1.88 million shares, CMF slipped to −0.0557, just below zero. That is not yet strong distribution, but it confirms that buying pressure has faded while the stock trades in a $170 to $182 range below its high.
How traders use CMF
1. Zero-line crosses
CMF crossing above zero shows buying pressure taking over; crossing below shows selling pressure. To filter noise, many traders wait for readings beyond +0.05 or −0.05, or for CMF to stay on one side for several days.
2. Confirmation
A breakout with CMF well above zero, like Agilent’s in late September, is backed by buying. A breakout with CMF near or below zero is more suspect.
3. Divergence
Rising CMF in a falling market suggests accumulation; falling CMF in a rising market suggests distribution. Agilent showed both: buying into the February–March decline and fading money flow at the October–November highs.
4. Strength of pressure
Readings beyond about ±0.25 mean closes have been consistently near one end of the range on meaningful volume. Agilent’s −0.36 in December and +0.4 in September were such extremes.
CMF settings
| Period | Use |
|---|---|
| 20 (default) | About a month of trading; standard |
| 21 | Also common; one calendar month of trading days |
| 10 | Faster; more zero crossings |
| 50 or more | Longer-term accumulation and distribution |
Limitations of CMF
- Ignores gaps. CMF looks only within each day’s range, so a large gap up or down adds nothing by itself; only where the stock closes after the gap counts.
- Single-bar extremes. A day with a close exactly at the high or low and huge volume can swing CMF for 20 days and then drop out of the window at once.
- Narrow ranges. When high and low are almost equal, a tiny move in the close changes the multiplier from −1 to +1.
- Divergences can last. Agilent’s February–March divergence took weeks to pay off.
- Not a prediction. Combine CMF with the trend, support and resistance and fundamentals.
Frequently asked questions
What is Chaikin Money Flow?
Chaikin Money Flow (CMF), developed by Marc Chaikin, measures buying and selling pressure over a set period, usually 20 days. It weights each day’s volume by where the close falls within the day’s high-low range, then divides the total by the total volume. The result moves between −1 and +1 around a zero line.
How is Chaikin Money Flow calculated?
For each bar, money flow multiplier = ((close − low) − (high − close)) / (high − low), and money flow volume = multiplier × volume. CMF = sum of money flow volume over 20 bars / sum of volume over the same 20 bars.
What does a positive or negative CMF mean?
A positive CMF means that, weighted by volume, closes have tended to be in the upper half of the daily ranges, a sign of accumulation or buying pressure. A negative CMF means closes have tended to be in the lower half, a sign of distribution or selling pressure.
What is a strong Chaikin Money Flow reading?
Readings beyond about +0.25 or −0.25 show strong, sustained pressure in one direction. Values close to zero mean buying and selling pressure have been roughly balanced. Many traders use small thresholds such as +0.05 and −0.05 to filter out noise around the zero line.
What is the difference between CMF and the Accumulation/Distribution line?
Both use the same money flow multiplier. The Accumulation/Distribution line is a running total of money flow volume since the start of the data, so its level is arbitrary. CMF looks at a fixed window, usually 20 days, and divides by volume, so it is an oscillator with a meaningful zero line.
What is the difference between CMF and the Money Flow Index?
The Money Flow Index sorts each day’s money into inflow or outflow depending on whether the typical price rose or fell from the previous day. CMF ignores the previous day and looks only at where the close sits within each day’s own range.