- What it is
- Formula
- Worked example
- Levels
- Reading the chart
- Trading signals
- vs Stochastic
- Limitations
- FAQ
What is Williams %R?
Larry Williams developed %R (“percent range”) in the 1970s for trading commodities. Like the stochastic, it rests on the idea that in an uptrend prices tend to close near the top of their recent range and in a downtrend near the bottom. Williams chose to measure the distance from the top of the range, which is why the scale runs from 0 down to −100.
There is a single line, no signal line and, in its standard form, no smoothing. That makes %R very responsive: it can go from one extreme to the other in a couple of days.
Williams %R formula
n = lookback period, usually 14 · the range includes today’s high and low
Algebraically, %R = fast stochastic %K − 100. A stochastic %K of 70 is a %R of −30; a %K of 5 is a %R of −95.
Worked example
Over the last 14 days a stock traded between $40 (lowest low) and $50 (highest high), the same range as on the stochastic page.
| Close | Williams %R | Stochastic %K | Reading |
|---|---|---|---|
| $49 | −100 × (50 − 49) / 10 = −10 | 90 | Overbought: closing near the top of the range |
| $47 | −30 | 70 | Upper half of the range |
| $45 | −50 | 50 | Middle of the range |
| $42 | −80 | 20 | On the oversold line |
| $40.50 | −95 | 5 | Oversold: closing near the bottom of the range |
The relationship never changes: %R is always %K minus 100. If you already read the stochastic, reading %R is just a matter of shifting the scale.
What Williams %R levels mean
| Williams %R | Reading |
|---|---|
| 0 to −20 | Overbought: closes near the top of the 14-day range |
| −20 to −50 | Upper half: buyers in control |
| −50 to −80 | Lower half: sellers in control |
| −80 to −100 | Oversold: closes near the bottom of the 14-day range |
As with every oscillator, “overbought” is not “about to fall”. In a strong uptrend %R lives between 0 and −20, and in a strong downtrend between −80 and −100.
Reading Williams %R on a chart: PayPal (PYPL)
The daily chart of PayPal (PYPL) below covers one year. The upper panel shows price with the 10, 50 and 200-day SMAs; the lower panel shows Williams %R (14) in purple, with the −20, −50 and −80 levels marked.
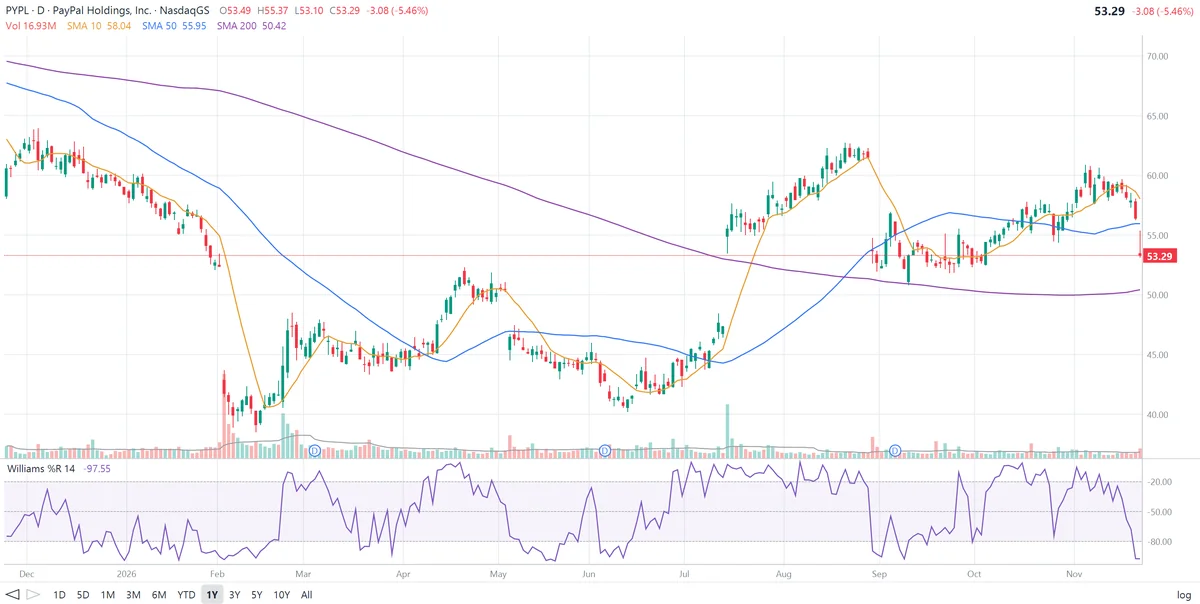
The reading checks out against the candles: with the day’s low of $53.10 as the bottom of the 14-day range, a %R of −97.55 puts the top of the range at about $60.86, which matches PayPal’s highs in early November.
What Williams %R shows on this chart:
- Pinned low in a downtrend. From December to mid-February PayPal fell from about $63 to below $40, including a gap down in early February. Williams %R spent almost all of January and the first half of February below −80. Each “oversold” reading was followed by lower prices.
- From one extreme to the other. In late February PayPal jumped from about $41 to $49 in a few days, and %R went from near −100 to above −20. No smoothing means no delay: %R flags a sharp reversal on the day it happens.
- Overbought in an uptrend. From late June to late August PayPal climbed from about $41 to $62, including a gap up in mid-July. %R stayed above −20 for most of July and much of August. Selling the first overbought reading at the end of June, near $44, would have meant missing about $18 of upside.
- Swing tops and bottoms. In April (top near $52), early September (low near $51) and October to early November (top near $61), %R moved from one zone to the other with each swing. Moves out of the zones, back below −20 or back above −80, lined up with the turns.
- The latest reading. After a 5.5% drop to $53.29, the close is less than 3% above the bottom of the 14-day range: %R is −97.55, deeply oversold. Price is below its 10 and 50-day SMAs but still above the 200-day. The first sign of a rebound would be %R climbing back above −80.
How traders use Williams %R
1. Exits from the extreme zones
Buy when %R rises back above −80 after being oversold; sell when it falls back below −20 after being overbought. Waiting for the exit, rather than acting on the first touch, filters out much of the January-February damage seen on PayPal.
2. With the trend
In an uptrend, use dips to −80 as entry points and ignore overbought readings; in a downtrend, use rallies to −20 as selling points. A 50 or 200-day moving average is a simple trend filter.
3. Momentum failure
Williams’ own refinement: after %R reaches the overbought zone, pulls back, and then fails to get back into it on the next rally, upward momentum is failing. The mirror pattern near −80 warns that selling pressure is fading.
4. Divergence
Price making a new high while %R fails to reach its previous high, or a new low while %R holds above its previous low, points to weakening momentum, as on the RSI.
Williams %R vs the stochastic oscillator
| Williams %R | Stochastic | |
|---|---|---|
| Scale | 0 to −100 | 0 to 100 |
| Measures from | Highest high | Lowest low |
| Overbought / oversold | −20 / −80 | 80 / 20 |
| Lines | One, unsmoothed | %K and %D (signal line), often smoothed |
| Relation | %R = fast %K − 100: the same information on a shifted scale | |
If you use the slow stochastic, adding Williams %R mostly adds a faster, unsmoothed view of the same thing. Pick the one whose speed suits your holding period.
Limitations of Williams %R
- Extremes in trends. %R can stay overbought or oversold for weeks, as PayPal showed at both ends of the year.
- Very fast. With no smoothing, a single strong close can swing it across the whole scale.
- No signal line. Crossover signals need an extra moving average or a second indicator.
- Not a prediction. Combine %R with the trend, support and resistance, volume and fundamentals.
Frequently asked questions
What is Williams %R?
Williams %R, developed by Larry Williams, is a momentum oscillator that shows where the latest close sits within the high-low range of the last 14 periods, on a scale from 0 (at the highest high) to −100 (at the lowest low).
How is Williams %R calculated?
Williams %R = −100 × (highest high of n periods − close) / (highest high of n periods − lowest low of n periods). With n = 14, a close at the 14-day high gives 0 and a close at the 14-day low gives −100.
What do −20 and −80 mean on Williams %R?
Readings from 0 to −20 are considered overbought: the stock is closing near the top of its recent range. Readings from −80 to −100 are considered oversold: it is closing near the bottom. In strong trends %R can stay in these zones for weeks.
What is the difference between Williams %R and the stochastic oscillator?
They use the same inputs. Williams %R equals the fast stochastic %K minus 100, so it is the same line on a scale shifted to 0 to −100, without a signal line and usually without smoothing.
Why is Williams %R negative?
Larry Williams measured the distance of the close below the highest high, so the value is shown as a negative percentage. Some charting tools drop the minus sign, but the readings mean the same thing.
What period should I use for Williams %R?
14 periods is the most common default. Williams’ original used 10. Shorter periods make the line faster and noisier; longer periods, such as 28, make it smoother.