- What it is
- Formula
- Worked example
- Settings
- Reading the chart
- Trading signals
- vs RSI and Stochastic
- Limitations
- FAQ
What is the Stochastic RSI?
Tushar Chande and Stanley Kroll introduced the Stochastic RSI in 1994. Their problem with RSI was that it can spend weeks between 30 and 70 without ever giving a signal. Their fix: instead of asking “is RSI above 70?”, ask “is RSI near the top of its own recent range?”. A stock whose RSI ranged between 45 and 60 over the past two weeks is “overbought” by StochRSI standards when RSI reaches 60, even though plain RSI would call 60 neutral.
The answer is a value from 0 to 1 (or 0 to 100 on most charts). Charting tools then smooth it into two lines, %K and %D, exactly like the slow stochastic.
Stochastic RSI formula
RSI = 14-period RSI · n = stochastic lookback, usually 14 · the range includes today’s RSI
Compare it with the stochastic formula: the close, highest high and lowest low are simply replaced by RSI, highest RSI and lowest RSI.
Worked example
Over the last 14 days a stock’s RSI ranged between 40 and 60. Here is what StochRSI does as RSI moves within that range:
| RSI today | StochRSI | Plain RSI reading | StochRSI reading |
|---|---|---|---|
| 60 | 100 × (60 − 40) / 20 = 100 | Neutral | Overbought: RSI at its 14-day high |
| 55 | 75 | Neutral | Upper part of the range |
| 45 | 25 | Neutral | Lower part of the range |
| 41 | 5 | Neutral | Oversold |
A 10-point move in RSI, from 55 to 45, moves StochRSI by 50 points, from 75 to 25. That amplification is the point of the indicator, and also its weakness. Smoothing takes some of it out: if the raw StochRSI readings for the last three days were 75, 60 and 25, then %K = (75 + 60 + 25) / 3 = 53.33; and if the two previous %K values were 70 and 65, %D = (70 + 65 + 53.33) / 3 = 62.78. %K is now below %D: a bearish crossover.
Settings
| Setting | Default | What it does |
|---|---|---|
| RSI length | 14 | Period of the underlying RSI |
| Stochastic length | 14 | How many RSI values make up the high-low range |
| %K smoothing | 3 | Simple average of the raw StochRSI |
| %D smoothing | 3 | Simple average of %K (the signal line) |
Charts usually label it “Stoch RSI 14, 3, 3” or “3, 3, 14, 14”. Chande and Kroll’s original version was unsmoothed (%K smoothing of 1), which makes it even jumpier.
Reading the Stochastic RSI on a chart: Micron (MU)
The daily chart of Micron Technology (MU) below covers one year. The upper panel shows price with the 10, 50 and 200-day SMAs; the lower panel shows Stoch RSI (14, 3, 3): %K in blue, %D in orange, with 80 and 20 marked.
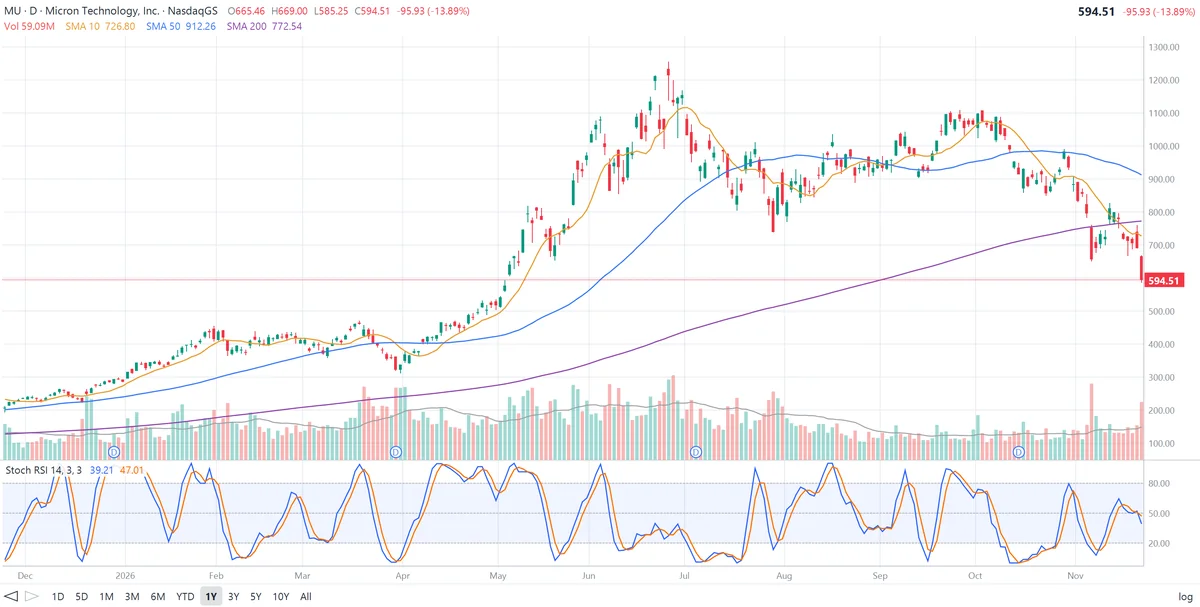
What the Stochastic RSI shows on this chart:
- Constant swings. Over the year %K went above 80 about a dozen times and below 20 about a dozen times. Compare that with plain RSI, which on most stocks reaches 70 or 30 only a few times a year. Every swing is a potential signal, which is why StochRSI is used for timing, not for calling tops and bottoms.
- Buying dips in an uptrend. From December to late January MU climbed from about $270 to $455. StochRSI dropped below 20 in mid-December and again in early February while the trend was up; both times the oversold reading marked a pullback, not a top, and the next leg up followed.
- Pinned high in a strong rally. From early April to mid-May MU more than doubled, from about $370 to $720, and %K stayed near 100 for most of those six weeks. An overbought StochRSI in a trend like this was a sign of strength, not a sell signal.
- A warning at the top. In early June MU reached about $1,100 with StochRSI near 98. In late June it went higher still, to its year high near $1,250, but StochRSI only got to about 40: momentum didn’t confirm the new high. In July the stock fell to the low $800s and StochRSI sat near zero for more than two weeks.
- Two-way swings, then the break. From August to early October MU traded between roughly $850 and $1,100, and StochRSI swung from one extreme to the other every few weeks. From early October it fell below 20 and stayed there as MU slid toward $860, then again in early November when the stock gapped down to about $650.
- The latest reading. After a 13.9% drop to $594.51, below its 10, 50 and 200-day SMAs, %K is 39.21 and %D is 47.01: %K has crossed below %D and both are falling. The smoothed %K lags. The raw StochRSI behind it is probably near zero after a day like this, and %K will follow it down over the next two bars unless RSI rebounds. If the two previous raw values averaged about 59, a raw reading of 0 today gives exactly this %K: (59 + 59 + 0) / 3 ≈ 39.
How traders use the Stochastic RSI
1. Pullback entries with the trend
The most common use: in an uptrend (for example, price above its 50 or 200-day moving average), buy when StochRSI crosses back above 20; in a downtrend, sell when it crosses back below 80.
2. %K / %D crossovers
As with the stochastic, %K crossing above %D is bullish and crossing below is bearish. Crossovers near the extremes carry the most weight.
3. Centerline
%K above 50 means RSI is in the upper half of its recent range, a sign of improving short-term momentum; below 50, the opposite.
4. Divergence
Price making a new high while StochRSI fails to reach its previous peak, as at MU’s June top, warns that momentum is fading. Divergences on such a fast indicator are frequent, so they are best confirmed with RSI or price action.
Stochastic RSI vs RSI vs Stochastic
| Stochastic RSI | RSI | Stochastic | |
|---|---|---|---|
| Input | RSI values | Closing prices | Close, high and low |
| Measures | RSI’s position in its recent range | Size of gains vs losses | Close’s position in the price range |
| Speed | Fastest | Slowest | In between |
| Overbought / oversold | 80 / 20, reached very often | 70 / 30, reached rarely | 80 / 20, reached often |
| Best for | Short-term entry timing | Trend momentum and divergence | Swing trading and ranges |
Limitations of the Stochastic RSI
- Very noisy. Small changes in RSI become large swings in StochRSI, so many signals are false.
- Two steps from price. It is a derivative of a derivative; a reading of 100 says RSI is at its two-week high, not that price is.
- Extremes in trends. Like the stochastic, it can stay pinned near 0 or 100 during strong moves.
- Not a prediction. Use it to time entries inside a trend you have identified by other means, and combine it with support, resistance, volume and fundamentals.
Frequently asked questions
What is the Stochastic RSI?
The Stochastic RSI (StochRSI), introduced by Tushar Chande and Stanley Kroll, applies the stochastic oscillator formula to RSI values instead of prices. It shows where today’s RSI sits within its own range over the last 14 periods, from 0 (at the lowest RSI) to 100 (at the highest).
How is Stochastic RSI calculated?
StochRSI = (RSI − lowest RSI of n periods) / (highest RSI of n periods − lowest RSI of n periods), usually multiplied by 100. Charting tools then smooth it: %K is a 3-period average of StochRSI and %D is a 3-period average of %K.
What is the difference between RSI and Stochastic RSI?
RSI measures price momentum on a 0–100 scale and rarely reaches its extremes. Stochastic RSI measures where RSI sits within its own recent range, so it swings between 0 and 100 much more often and reacts sooner, at the cost of many more false signals.
What do 80 and 20 mean on Stochastic RSI?
Above 80, RSI is near the top of its recent range (overbought); below 20, near the bottom (oversold). Because StochRSI hits these levels often, the readings are better used to time entries in the direction of the trend than as reversal signals on their own.
What do the settings 14, 3, 3 mean?
The 14 is the RSI length (and usually also the stochastic lookback), the first 3 is the smoothing for %K and the second 3 is the smoothing for %D. The full default is often written 3, 3, 14, 14.
Can Stochastic RSI reach 0 on a big down day?
The raw StochRSI can drop to 0 in one day if RSI falls to its lowest level of the lookback period. The smoothed %K line falls more slowly because it averages the last three values.