- What it is
- Formula
- Worked example
- Fast vs slow
- Reading the chart
- Trading signals
- Stochastic vs RSI
- Limitations
- FAQ
What is the stochastic oscillator?
George Lane developed the stochastic oscillator in the 1950s. His observation was that momentum changes before price: in a rising market closes cluster near the top of the recent range, and when they start landing lower in the range, the advance is losing force even if price is still near its highs.
The indicator has two lines: %K, the position of the close in the range, and %D, a 3-period moving average of %K that acts as a signal line. Both run from 0 to 100, with 80 and 20 marking overbought and oversold.
Stochastic formulas
n = lookback period, usually 14 · the range includes today’s high and low
SMA3 = 3-period simple moving average
Williams %R uses the same inputs: it is simply the fast %K minus 100, on a 0 to −100 scale.
The general “full” stochastic has three settings: the lookback, the smoothing of %K and the smoothing of %D. Fast (14, 3) is full (14, 1, 3); slow (14, 3, 3) is full (14, 3, 3).
Worked example
Over the last 14 days a stock has traded between $40 (lowest low) and $50 (highest high), and that range doesn’t change over the next five days. Its closes are $46, $48, $47, $49 and $45.
| Day | Close | Fast %K | Fast %D = Slow %K | Slow %D |
|---|---|---|---|---|
| 1 | $46 | 100 × (46 − 40) / 10 = 60 | – | – |
| 2 | $48 | 80 | – | – |
| 3 | $47 | 70 | (60 + 80 + 70) / 3 = 70.00 | – |
| 4 | $49 | 90 | (80 + 70 + 90) / 3 = 80.00 | – |
| 5 | $45 | 50 | (70 + 90 + 50) / 3 = 70.00 | (70 + 80 + 70) / 3 = 73.33 |
On day 5 the fast %K drops 40 points, from 90 to 50, in one day. The slow %K drops only 10 points, from 80 to 70, and the slow %D barely moves. That is the whole difference between the two versions: the slow stochastic smooths out single-day swings so its crossovers mean more.
Fast vs slow stochastic
| Fast (14, 3) | Slow (14, 3, 3) | |
|---|---|---|
| %K line | Raw position of the close in the range | 3-period average of the raw %K |
| %D line | 3-period average of %K | 3-period average of the slow %K |
| Behavior | Jumps with every close; many crossovers | Smoother; fewer, later crossovers |
| Typical use | Very short-term trading, early warnings | The standard version for most traders |
A quick check that you are reading the right numbers: the slow %K always equals the fast %D on the same bar.
Reading the stochastic on a chart: NVDS
The chart below covers one year of the Tradr 1.5X Short NVDA Daily ETF (NVDS), a leveraged fund designed to move 1.5 times the opposite of NVIDIA’s daily move. The upper panel shows price with the 10, 50 and 200-day SMAs; the middle panel the fast stochastic (14, 3); the lower panel the slow stochastic (14, 3, 3). %K is blue, %D orange, and the 80–20 band is shaded.
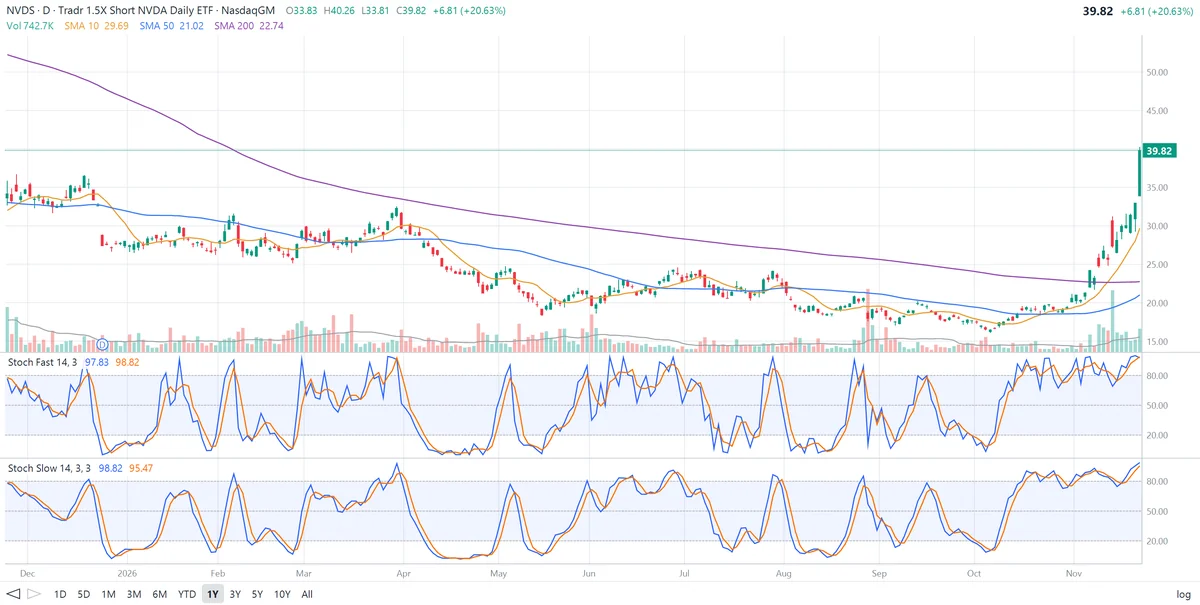
The numbers fit together: the slow %K (98.82) equals the fast %D, as it should. A fast %K of 97.83 means the $39.82 close was about 98% of the way up the 14-day range; with the day’s high of $40.26 at the top, the bottom of that range works out to about $20, which matches the early-November lows.
What the stochastic shows on this chart:
- Fast vs slow. Compare the two panels: the fast lines zigzag and cross constantly, while the slow lines make clean swings from one extreme to the other. Most of the fast crossovers are noise that the slow version filters out.
- Oversold can stay oversold. After a sharp drop in late December, NVDS spent most of January near $27–$29 and the slow stochastic sat near the bottom of its range. The same happened from April into mid-May: the slow %K stayed below 20, often near zero, for about six weeks while the fund fell from about $30 to $18.50. In a steady downtrend, closes keep landing near the bottom of the range and the stochastic stays pinned low.
- Swings in a range. From June to early October NVDS moved roughly between $16 and $25 and the slow stochastic swung cleanly between the extremes: overbought in June and late July, oversold in mid-July, most of August and late September. In a sideways market like this, buying %K/%D crosses up from below 20 and selling crosses down from above 80 works best.
- The turn in October. In early October the slow %K crossed above %D at about 12, near the year’s low of about $16.30. That crossover from deep oversold marked the start of the biggest move on the chart.
- Overbought can stay overbought. From mid-October to the last bar NVDS climbed from about $17 to $39.82, and the slow stochastic stayed above 80 for most of that time, dipping only into the high 70s between legs. Selling the first overbought reading in mid-October would have meant missing a move of well over 100%. It is the mirror image of April.
- The latest reading. After a 20.6% jump on the last bar, every line is near 100 and the close is 34% above the 10-day SMA and 89% above the 50-day. By the stochastic’s logic the next signal to watch is a slow %K cross below %D from above 80, which hasn’t happened yet.
NVDS is used here only to illustrate the indicator. Leveraged and inverse ETFs reset daily and can lose value over time even when the underlying stock moves the expected way.
How traders use the stochastic
1. %K / %D crossovers
%K crossing above %D is bullish, crossing below is bearish. Crossovers that happen below 20 (for buys) or above 80 (for sells) carry the most weight; crossovers in the middle of the range are mostly noise.
2. Overbought and oversold, with the trend
In an uptrend, use dips below 20 as buying opportunities and ignore overbought readings; in a downtrend, do the opposite. The trend filter can be as simple as price above or below its 50-day moving average.
3. Divergence
As with RSI, price making a higher high while the stochastic makes a lower high is a bearish divergence, and a lower low in price with a higher low in the stochastic is bullish. Lane considered divergence the most important stochastic signal.
4. Embedded stochastic
When the slow stochastic stays above 80 for several days, as on NVDS in November, the trend is strong; many traders treat this as a sign to hold rather than to sell, and wait for the line to drop back below 80 before acting.
Stochastic vs RSI
| Stochastic | RSI | |
|---|---|---|
| Measures | Close relative to the recent high-low range | Size of recent gains vs losses |
| Overbought / oversold | 80 / 20 | 70 / 30 |
| Behavior | Faster; swings to extremes often | Smoother; extremes are rarer |
| Signal line | Yes (%D) | No |
| Best in | Sideways markets and swing trading | Trends and divergences |
Limitations of the stochastic
- Extremes in trends. In a strong trend the stochastic can stay pinned near 0 or 100 for weeks, so 80/20 signals against the trend lose money, as April and November on NVDS show.
- Noisy, especially the fast version. The fast stochastic can cross its signal line every few days, and the Stochastic RSI, which applies the same formula to RSI, is noisier still.
- Range-dependent. A very narrow 14-day range makes the indicator swing wildly on small price moves.
- Not a prediction. Combine the stochastic with the trend, support and resistance, volume and fundamentals.
Frequently asked questions
What is the stochastic oscillator?
The stochastic oscillator, developed by George Lane, shows where today’s close sits within the range of the last 14 periods, from 0 (at the lowest low) to 100 (at the highest high). It is drawn as two lines, %K and its moving average %D, and is used to spot overbought and oversold conditions and momentum turns.
What is the difference between fast and slow stochastic?
The fast stochastic plots the raw %K and a 3-period average of it as %D. The slow stochastic smooths once more: its %K is the fast %D, and its %D is a 3-period average of that. The slow version gives fewer, more reliable crossovers and is the one most traders use.
How is the stochastic oscillator calculated?
Fast %K = 100 × (close − lowest low of n periods) / (highest high of n periods − lowest low of n periods). Fast %D = 3-period simple average of fast %K. Slow %K = fast %D, and slow %D = 3-period simple average of slow %K.
What do 80 and 20 mean on the stochastic?
Above 80 the stock is closing near the top of its recent range and is considered overbought; below 20 it is closing near the bottom and considered oversold. In strong trends the stochastic can stay above 80 or below 20 for weeks.
What is a stochastic crossover?
When %K crosses above %D, momentum is turning up; when it crosses below, momentum is turning down. Crossovers below 20 or above 80 are considered the most meaningful.
Stochastic or RSI: which is better?
They answer different questions. RSI compares the size of gains and losses; the stochastic compares the close with the recent high-low range. The stochastic reacts faster and swings more often between extremes, while RSI is smoother. Many traders use one of them, not both.