What is the Commodity Channel Index?
Donald Lambert introduced CCI in 1980 to find cyclical turns in commodity markets. The idea is statistical: compare today’s price with its moving average, and scale the gap by how far price normally strays from that average. A stock that usually stays within $2 of its average and is now $6 above it is doing something unusual; a stock that routinely swings $10 around its average is not.
Lambert picked a constant of 0.015 so that roughly 70–80% of readings fall between −100 and +100. Readings outside that band are, by design, the unusual ones.
CCI formula
TP = typical price of each bar
SMAn(TP) = n-period simple moving average of the typical price · the sum runs over the same n bars
n = 20 by default
Note that CCI uses the mean absolute deviation, not the standard deviation, which makes it a little less sensitive to a single outlier.
Worked example: a 5-period CCI
To keep the arithmetic short, take a 5-period CCI (the standard is 20). The last five typical prices are $50, $51, $52, $53 and $56.
| Step | Day 5 | Day 6 (next TP = $54) |
|---|---|---|
| Window | 50, 51, 52, 53, 56 | 51, 52, 53, 56, 54 |
| SMA of TP | 262 / 5 = 52.40 | 266 / 5 = 53.20 |
| Absolute deviations | 2.4, 1.4, 0.4, 0.6, 3.6 | 2.2, 1.2, 0.2, 2.8, 0.8 |
| Mean deviation | 8.4 / 5 = 1.68 | 7.2 / 5 = 1.44 |
| CCI | (56 − 52.40) / (0.015 × 1.68) = 142.86 | (54 − 53.20) / (0.015 × 1.44) = 37.04 |
On day 5 a jump to $56 puts the typical price far above its average compared with the usual deviation: CCI 143, above +100. On day 6 price slips to $54, still above the average but not by much, and CCI falls to 37. How big a reading a move produces depends on how volatile the recent bars were: the larger the mean deviation, the smaller the CCI for the same distance from the average.
What CCI levels mean
| CCI | Reading |
|---|---|
| Above +200 | Extreme: price far above average, often after a gap or a news-driven move |
| +100 to +200 | Strong upward move; Lambert’s zone for a new uptrend |
| −100 to +100 | Normal range; no unusual move (most readings) |
| −100 to −200 | Strong downward move; Lambert’s zone for a new downtrend |
| Below −200 | Extreme: price far below average |
Reading CCI on a chart: Dell Technologies (DELL)
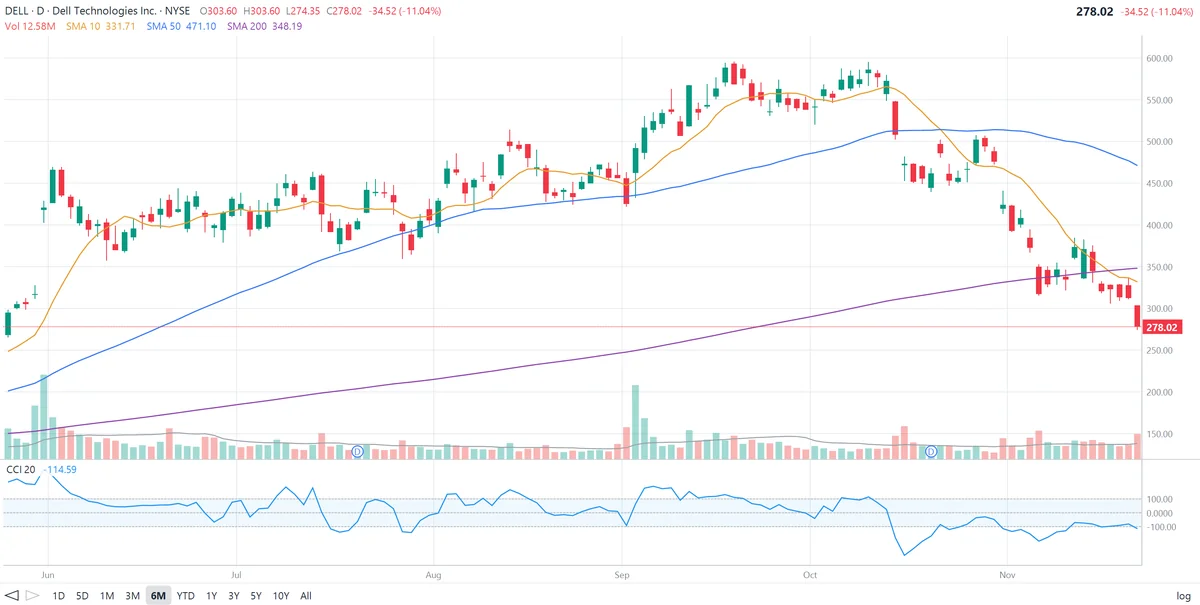
The daily chart of Dell Technologies (DELL) below covers six months. The upper panel shows price with the 10, 50 and 200-day SMAs; the lower panel shows CCI (20), with the +100, 0 and −100 levels marked and the normal band shaded.
What CCI shows on this chart:
- Off the scale on a gap. At the end of May Dell gapped up from around $300 to about $470, and CCI shot to about +260, the highest reading on the chart. Because CCI has no ceiling, the size of the reading tells you how unusual the move was.
- Swings in a range. From June to mid-August Dell traded between roughly $360 and $520, and CCI swung between about −140 and +170: below −100 at the mid-July and late-July lows near $360–$370, above +100 at the mid-August high near $515. In a range, the ±100 lines marked the turns.
- Trend mode. In early September Dell jumped from about $430 to $500 and kept going to about $595 by mid-September. CCI crossed above +100 and stayed there for about two weeks: Lambert’s signal for a strong new uptrend rather than a sell.
- A bearish divergence. In early October Dell came back to about $595, matching its September high, but CCI only reached about +110 against roughly +180 in September. Price was at the high; momentum wasn’t.
- The drop. In mid-October Dell gapped down from about $565 toward $460 and CCI plunged to about −300, the lowest reading of the six months. Through November, as the stock slid to the low $300s, CCI stayed mostly below −100: trend mode again, this time down.
- The latest reading. After an 11% fall to $278.02, below all three SMAs, CCI is −114.59. That is less extreme than the October reading, even though the stock fell 11% in one day. The reason is in the formula: after a month of large swings the mean deviation is big, so the same distance from the average counts for less. The day’s typical price is (303.60 + 274.35 + 278.02) / 3 = $285.32.
How traders use CCI
1. Lambert’s trend signals
Lambert’s original rule: buy when CCI rises above +100 and exit when it falls back below +100; sell short when it drops below −100 and cover when it rises back above. A move beyond ±100 marks the start of a strong move, as in Dell’s September rally and November slide.
2. Overbought and oversold
Many traders read it the other way: CCI above +100 (or +200) is overbought, below −100 (or −200) oversold, and a move back inside the band is the signal. This works better in ranges, like Dell’s June to August.
3. Zero-line crosses
CCI crossing above 0 means the typical price has moved above its 20-period average; below 0, below it. It is a simple, fast trend filter.
4. Divergence
A new price high with a lower CCI high (as on Dell in early October), or a new price low with a higher CCI low, signals weakening momentum.
Settings
| Period | Use |
|---|---|
| 20 (standard) | The common default; about one month of daily bars |
| 14 | Faster; more frequent ±100 crossings |
| 50 or 100 | Slower; longer-term trend view, extremes are rarer |
Limitations of CCI
- Two opposite readings. A reading above +100 can be read as “strong trend, buy” or “overbought, sell”. You need a trend filter, such as a 50 or 200-day moving average, to decide.
- No fixed bounds. Extremes of ±200 or ±300 are possible, so overbought and oversold thresholds are a judgment call.
- Volatility shifts its scale. As Dell’s last bar shows, a big move after a volatile month produces a smaller reading than the same move after a quiet month.
- Not a prediction. Combine CCI with support and resistance, volume and fundamentals.
Frequently asked questions
What is the Commodity Channel Index?
The Commodity Channel Index (CCI), developed by Donald Lambert in 1980, measures how far the current typical price is from its moving average, relative to the average size of past deviations. Despite its name, it is used on stocks, ETFs and every other market.
How is CCI calculated?
Typical price = (high + low + close) / 3. Take its 20-period simple moving average and the mean absolute deviation of the typical price from that average. CCI = (typical price − moving average) / (0.015 × mean deviation).
What do +100 and −100 mean on CCI?
Lambert’s constant of 0.015 was chosen so that most CCI readings fall between −100 and +100. A move above +100 means price is unusually far above its average, which Lambert read as the start of a strong uptrend; below −100, unusually far below, the start of a strong downtrend.
Is CCI bounded like RSI?
No. CCI has no upper or lower limit. Readings of ±200 or ±300 occur after large, fast moves such as earnings gaps. That makes it different from RSI and the stochastic, which stay between 0 and 100.
Is CCI a trend or an overbought/oversold indicator?
Both, depending on how it is used. Lambert used moves beyond ±100 as trend signals in the direction of the move. Many traders instead treat extreme readings as overbought or oversold. Combining it with a trend filter helps decide which reading applies.
What period should I use for CCI?
20 periods is the most common default. Some traders use 14 for a faster line, or 50 or 100 for a longer-term view.