What is the Accumulation/Distribution Line?
The A/D line asks two questions about every bar: how much stock traded, and who was in control at the close? The second answer comes from the close location: a close at the very top of the range counts all of the day’s volume as buying, a close at the bottom counts all of it as selling, and a close in the middle counts none of it. Each day’s result is added to a running total.
Like On-Balance Volume, the line is cumulative, so its number depends on where the data starts and can be positive or negative. Only the direction of the line and how its highs and lows compare with price carry information.
A/D line formula
Multiplier = +1 when the close is at the high, 0 at the midpoint, −1 at the low. The same multiplier is used by Chaikin Money Flow
Worked example
Four days, with volumes of 10,000, 15,000, 12,000 and 20,000 shares:
| Day | Low–High | Close | Mult. | A/D |
|---|---|---|---|---|
| 1 | 19–21 | 20.80 | +0.80 | +8,000 |
| 2 | 20.5–21.5 | 20.70 | −0.60 | −1,000 |
| 3 | 20.2–21.2 | 21.10 | +0.80 | +8,600 |
| 4 | 21–22 | 21.20 | −0.60 | −3,400 |
Day 4 is the one to notice. The stock closed 10 cents higher than day 3, but it closed near the bottom of a $21 to $22 range on the heaviest volume of the four days. Its money flow volume was −0.60 × 20,000 = −12,000 shares, and the A/D line fell from +8,600 to −3,400 on an up day.
A/D line vs On-Balance Volume
| A/D line | OBV | |
|---|---|---|
| Compares the close with | Today’s own high-low range | Yesterday’s close |
| Volume counted | A fraction, −100% to +100% | All of it, added or subtracted |
| Gaps | Ignored | Count fully |
| Up day closing near the low | Line falls | Line rises |
The two often agree, but when they disagree the A/D line is telling you about intraday control and OBV about day-to-day direction.
Reading the A/D line on a chart: PepsiCo (PEP)
The daily chart of PepsiCo (PEP) below covers one year, with volume in the upper panel and the A/D line in the lower panel.
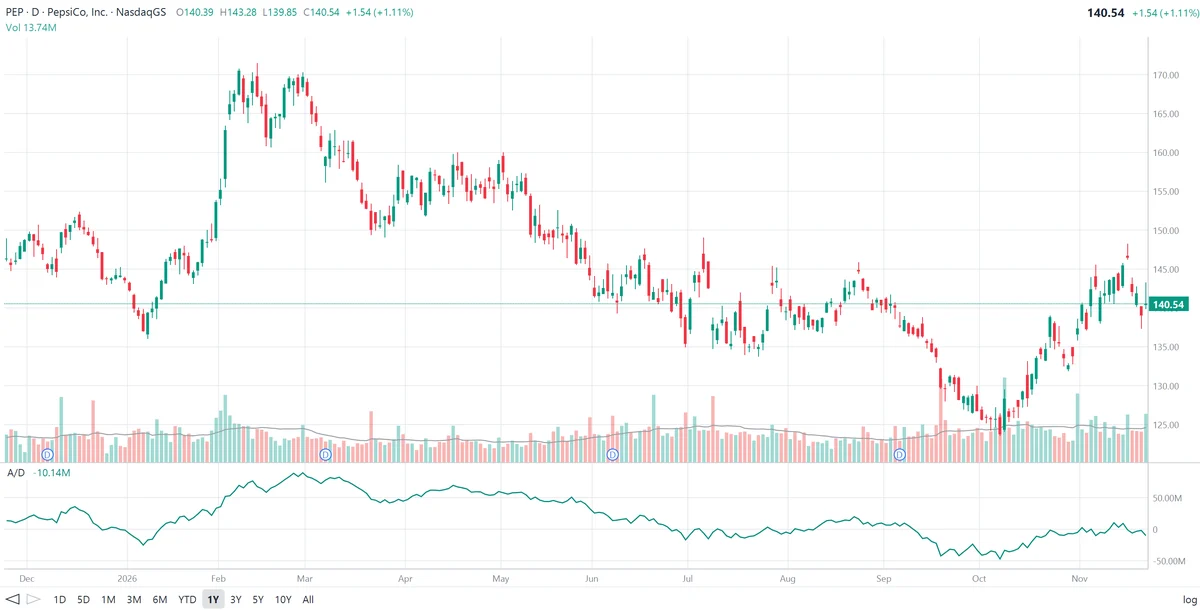
The last bar is a real-world version of day 4 above. PepsiCo closed $1.54 higher, but within a $139.85 to $143.28 range it closed at $140.54, well below the middle. The multiplier is ((140.54 − 139.85) − (143.28 − 140.54)) / 3.43 = −0.60, so the A/D line fell by 0.60 × 13.74M ≈ 8.21 million, from about −1.93 million to −10.14 million. OBV would have added the full 13.74 million.
What the A/D line shows on this chart:
- A December pullback. The line peaked at about +35 million in mid-December with PepsiCo near $152, then fell to about −24 million in early January as the stock dropped to about $136.
- A rally with heavy buying. From mid-January to February PepsiCo climbed from about $136 to about $171, with several wide up days closing near their highs on heavy volume. The A/D line rose to about +90 million by late February, its high of the year. Price and A/D rose together: the advance was well supported.
- Holding up in the spring. The March drop to about $150 pulled the line down to about +45 million, but in April and early May, while PepsiCo tested $160 twice, A/D recovered to about +60 to +70 million.
- Slow distribution. From May to early July the stock slid to the $135 to $148 range and the line drifted from about +60 million to about −15 million: steady selling without a single dramatic day.
- The autumn low. A sharp drop in mid-September, from about $138 to about $131 on heavy volume, sent A/D to about −41 million. PepsiCo made its low near $124 in early October, with the line at about −46 million, its lowest reading.
- A recovery that lagged price. The rally from about $124 to about $148 in mid-November lifted the A/D line only to about +11 million. The last time PepsiCo traded near $145, in June, the line was around +15 to +30 million. Price has recovered more than the volume-weighted buying behind it, and the latest up day that closed weak pulled A/D back to −10.14 million.
How traders use the A/D line
1. Trend confirmation
A rising price with a rising A/D line, like PepsiCo’s January–February rally, shows buyers closing the stock near its highs on strong volume. A rising price with a flat or falling line is a warning that the advance lacks support.
2. Divergence
Price makes a new high and A/D does not: bearish. Price makes a new low and A/D holds above its previous low: bullish. Divergences on the A/D line can last for weeks before price responds.
3. Breakouts on the line itself
Traders draw trendlines and support levels on the A/D line and watch for it to break them, sometimes before price breaks the corresponding levels.
4. Chaikin Oscillator and CMF
The Chaikin Oscillator, the 3-day EMA of the A/D line minus its 10-day EMA, measures the momentum of the line. Chaikin Money Flow uses the same multiplier over a fixed 20-day window, turning it into an oscillator with a meaningful zero line.
Limitations of the A/D line
- Ignores gaps. A stock that gaps down 10% and then closes at the top of its range adds volume to the line, even though holders lost money that day.
- Close location only. The multiplier depends on a single number, the close, so late-day moves have a large effect.
- Arbitrary level. The value depends on the start of the data; compare the line’s highs and lows, not its number.
- Volume spikes. One very heavy day can shift the line permanently, since nothing ever drops out of a cumulative total.
- Not a prediction. Combine the A/D line with the trend, support and resistance and fundamentals.
Frequently asked questions
What is the Accumulation/Distribution Line?
The Accumulation/Distribution Line (A/D), developed by Marc Chaikin, is a running total of volume weighted by where each bar closes within its high-low range. Closes near the high add most of the day’s volume; closes near the low subtract it. A rising line suggests accumulation (buying); a falling line suggests distribution (selling).
How is the A/D line calculated?
For each bar, money flow multiplier = ((close − low) − (high − close)) / (high − low), and money flow volume = multiplier × volume. The A/D line adds each bar’s money flow volume to the previous total: A/D today = A/D yesterday + money flow volume.
What is the difference between the A/D line and OBV?
On-Balance Volume adds or subtracts the whole day’s volume depending on whether the close was higher or lower than the previous close. The A/D line ignores the previous close and adds a fraction of the volume depending on where the close sits within the day’s range. A stock can close higher on the day and still lower its A/D line if it closed near the day’s low.
What does A/D divergence mean?
If price makes a new high but the A/D line does not, buying volume is not keeping up with the price, which can warn of a weakening advance. If price makes a new low but the A/D line holds above its previous low, selling pressure is fading, which can come before a rebound.
Why is the A/D number negative or so large?
The A/D line is cumulative from the first bar of the data, so its level depends on where the chart starts and can be positive or negative. Only its direction and its highs and lows compared with price are meaningful.
What is the difference between the A/D line and Chaikin Money Flow?
Both use the same money flow multiplier. The A/D line keeps a running total forever, while Chaikin Money Flow sums money flow volume over a fixed window, usually 20 days, and divides by volume, turning it into an oscillator around zero. The Chaikin Oscillator is a third variant: the difference between a 3-day and a 10-day EMA of the A/D line.