What is the Money Flow Index?
Every trading day, a certain amount of money changes hands: roughly the day’s typical price times the number of shares traded. MFI sorts those days into two piles. If the typical price rose from the day before, the day’s money counts as inflow; if it fell, as outflow. The indicator then asks what share of the last 14 days’ money flow went into the up pile.
Because it is weighted by volume, MFI gives a heavy-volume day far more say than a quiet one. A rally on thin volume barely moves it; a sell-off on heavy volume drags it down hard. That is the main difference from RSI, which looks only at the size of price changes. MFI was developed by Gene Quong and Avrum Soudack.
Money Flow Index formula
Positive flow: days the typical price rose; negative flow: days it fell. Equivalent: MFI = 100 × positive flow / (positive + negative flow)
Worked example
A 4-period MFI over five days (the real indicator uses 14):
| Day | Typical price | Volume | Money flow |
|---|---|---|---|
| 1 | $50.00 | 1,000 | start |
| 2 | $51.00 ▲ | 1,200 | +$61,200 |
| 3 | $50.50 ▼ | 800 | −$40,400 |
| 4 | $52.00 ▲ | 1,500 | +$78,000 |
| 5 | $51.50 ▼ | 1,000 | −$51,500 |
Positive flow = 61,200 + 78,000 = $139,200. Negative flow = 40,400 + 51,500 = $91,900. Money ratio = 139,200 / 91,900 = 1.515, so MFI = 100 − 100 / 2.515 = 60.2. The stock rose and fell on alternate days and ended only 50 cents above day 2, but the up days traded more volume, so MFI is above 50.
Reading MFI on a chart: DuPont (DD)
The daily chart of DuPont de Nemours (DD) below covers one year, with volume in the upper panel and MFI (14) in the lower panel, where the dashed lines mark 80, 50 and 20.
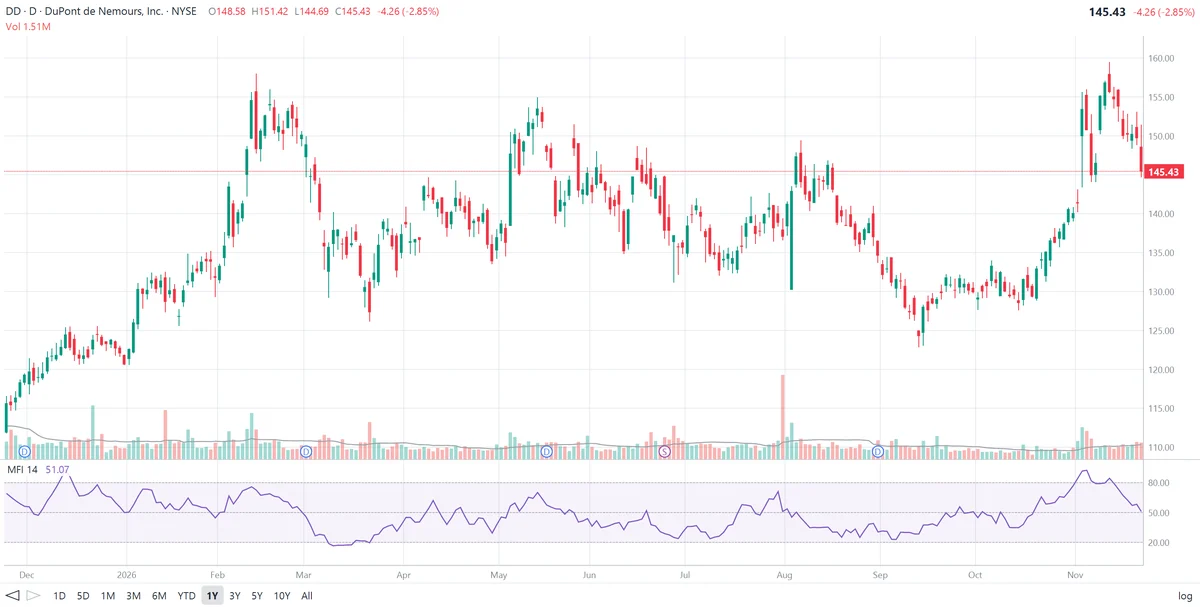
An MFI of 51.07 means the money ratio is 51.07 / 48.93 ≈ 1.04: over the last 14 days, slightly more money traded on up days than on down days. The last bar’s typical price, $147.18, was below the previous day’s, so its $222 million counts as negative flow and pulled MFI down.
What MFI shows on this chart:
- Overbought early, weaker later. In mid-December, as DuPont climbed from about $117 to $126, MFI rose to about 87. The rally continued to about $158 by mid-February, but MFI peaked at only about 76. Price made a much higher high on less money flow, a bearish divergence.
- Oversold in March. DuPont then dropped back to the low $130s and MFI fell below 20 in early March, reaching about 17, the lowest reading of the year. It stayed under 20 for about two weeks, a reminder that oversold can persist in a sell-off.
- A bullish divergence at the March low. When the stock made its lowest close of the decline, near $127 around March 20, MFI was already back around 20 to 25, above its earlier low. Selling volume was drying up, and DuPont rallied to about $145 in April and $155 in May.
- Summer: no extremes. From May to August MFI moved between about 25 and 70 while the stock swung between about $132 and $155. Without 80 or 20 readings, MFI gave no overbought or oversold signals.
- A quieter September low. MFI fell to about 23 in late August and early September, but when DuPont dropped to its September low near $123, MFI held above that level. That second bullish divergence came before the October base and the November rally.
- November: overbought, then fading. The rally from about $130 to about $159 pushed MFI above 80 for about two weeks, peaking near 93, the highest reading of the year, in early November. DuPont’s price high came several days after the MFI peak, on a lower MFI, and the stock has since slipped to $145.43 as MFI returned to the middle of its range.
How traders use MFI
1. Overbought and oversold
Above 80, money flow has been heavily one-sided toward buying; below 20, toward selling. Traders look for MFI to turn back below 80 or above 20 before acting, since strong trends can keep it at extremes, as in DuPont’s March decline.
2. Divergence
A new price high with a lower MFI high, or a new price low with a higher MFI low, shows that volume is not backing the move. DuPont produced both kinds: bearish from December to February, bullish in March and September.
3. Failure swings
Borrowed from RSI: MFI rises above 80, pulls back, fails to get back above 80 on the next rally and then breaks below its pullback low. The mirror image below 20 is a bullish failure swing.
4. The 50 line
Some traders use MFI above 50 as a sign that money flow favours buyers and below 50 as favouring sellers, a simple filter for trades in the direction of the flow.
MFI settings
| Setting | Use |
|---|---|
| 14 periods, 80/20 (default) | Standard; matches RSI’s lookback |
| 14 periods, 90/10 | Fewer, more extreme signals |
| 9 to 10 periods | Faster, more signals, more noise |
| 20 periods or more | Smoother; extremes are rarer |
Limitations of MFI
- All or nothing per day. Like OBV, each day’s whole money flow goes to one side based only on whether the typical price rose, however small the change.
- Volume spikes dominate. One day with several times the usual volume, such as earnings or index rebalancing, can swing MFI for 14 days and then drop out all at once.
- Extremes can persist. In strong trends MFI can stay above 80 or below 20 while price keeps going.
- Divergences are early. They can appear well before price turns, or not lead to a turn at all.
- Not a prediction. Combine MFI with the trend, support and resistance and fundamentals.
Frequently asked questions
What is the Money Flow Index?
The Money Flow Index (MFI) is a momentum oscillator that combines price and volume. It compares the money flowing into a stock on days its typical price rises with the money flowing out on days it falls, over 14 periods, and scales the result from 0 to 100. It is often called a volume-weighted RSI.
How is the Money Flow Index calculated?
Typical price = (high + low + close) / 3. Raw money flow = typical price × volume. Over 14 periods, add the raw money flow of days whose typical price rose (positive flow) and of days whose typical price fell (negative flow). Money ratio = positive flow / negative flow, and MFI = 100 − 100 / (1 + money ratio).
What are overbought and oversold levels for MFI?
Readings above 80 are commonly treated as overbought and readings below 20 as oversold. Some traders use 90 and 10 for stronger signals. In a strong trend MFI can stay above 80 or below 20 for a long time, so these levels are warnings rather than sell or buy signals on their own.
What is the difference between MFI and RSI?
RSI uses only closing prices. MFI uses the typical price and multiplies it by volume, so a move on heavy volume counts more than the same move on light volume. MFI therefore reacts to volume spikes and can diverge from RSI when price moves on thin trading.
What does an MFI of 50 mean?
An MFI of 50 means that over the last 14 periods the money flow on up days roughly equals the money flow on down days. Above 50, more money has traded on rising days; below 50, more on falling days.
Who created the Money Flow Index?
The Money Flow Index was developed by Gene Quong and Avrum Soudack and described in the late 1980s. It applies the structure of Welles Wilder’s RSI to money flow, which is price multiplied by volume.