What is On-Balance Volume?
A price chart shows where a stock went; the volume bars show how many shares changed hands on the way. OBV combines the two. Every share traded on an up day counts as buying pressure and every share traded on a down day as selling pressure, and OBV keeps the running balance.
The number itself means nothing: it depends on the first day of the data, so the same stock can show a different OBV on two charts, or a negative one. What matters is the shape of the line. Is it rising or falling, and are its highs and lows keeping pace with the highs and lows of price?
OBV formula
No period setting; the line starts from zero (or any value) on the first bar of the data
Worked example
| Day | Close | Volume | Change in OBV | OBV |
|---|---|---|---|---|
| 1 | $100.00 | 1.0M | – | 0 |
| 2 | $101.50 | 1.2M | +1.2M | 1.2M |
| 3 | $101.00 | 0.8M | −0.8M | 0.4M |
| 4 | $101.00 | 0.9M | 0 | 0.4M |
| 5 | $103.00 | 2.0M | +2.0M | 2.4M |
| 6 | $102.50 | 1.5M | −1.5M | 0.9M |
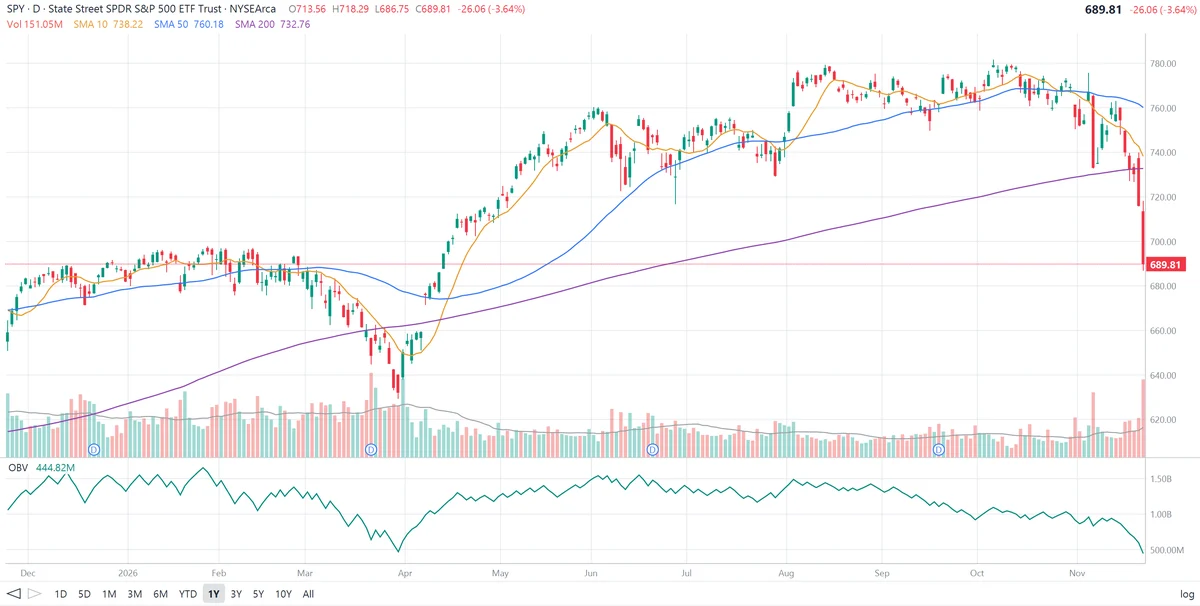
The size of the price move does not matter, only its direction: the 50-cent dip on day 6 removed all 1.5 million shares. The last bar on the SPY chart below works the same way. SPY closed $26.06 lower on 151.05 million shares, so OBV fell from 444.82 + 151.05 = 595.87 million to 444.82 million in one day.
Reading OBV on a chart: SPDR S&P 500 ETF (SPY)
The daily chart of the SPDR S&P 500 ETF Trust (SPY) below covers one year. The upper panel shows price with the 10, 50 and 200-day SMAs and volume; the lower panel shows OBV.
What OBV shows on this chart:
- An early warning in February. From December to February SPY moved sideways between about $680 and $698. OBV reached its high for the year, about 1.6 billion, in late January, but in February, with price still near the top of the range, OBV made a lower high of about 1.3 billion. Volume was leaning to the down days before price showed it.
- The March decline. SPY then fell to about $630 by the end of March and OBV dropped to about 0.5 billion, the low of the line until November.
- Confirmation on the way up. The rally from April to early June took SPY to about $760, and OBV climbed back to about 1.55 billion. Price and OBV rising together is what a healthy advance looks like.
- Higher prices, lower OBV. In August SPY broke out to about $778, but OBV peaked at about 1.5 billion, slightly below its June high. By early October SPY made its high for the year near $782, yet OBV had slid to about 1.0 billion, roughly a third below its June level. Price was within a few dollars of its high while volume had been leaning to the down days for two months: a clear bearish divergence.
- The latest reading. In November the selling came with heavy volume. The last bar, down 3.6% on 151 million shares, one of the heaviest volume days on the chart, took OBV to 444.82 million, below its late-March low of about 0.5 billion, even though SPY at $689.81 is still about $60 above its March low. Price has also dropped below the 200-day SMA ($732.76) and is under all three moving averages.
How traders use OBV
1. Trend confirmation
In a healthy uptrend, OBV makes higher highs and higher lows along with price. If price rises but OBV goes sideways or down, the advance is being made on lighter volume than the pullbacks, a sign of weak participation.
2. Divergence
A new price high without a new OBV high is a bearish divergence; a new price low with OBV holding above its previous low is a bullish one. On SPY the bearish divergence ran from August to October before price broke down. Like other divergences, it can last a long time before price follows.
3. OBV breakouts
Granville watched for OBV to break above its own previous highs, or below its lows, before price did. Traders draw trendlines on the OBV line itself and treat a break as an early signal.
4. Smoothing
Many traders add a 20-day moving average to OBV and watch for crosses, or compare OBV with its moving average to judge whether volume flow is improving or deteriorating.
OBV settings
OBV has no period: it is a cumulative total. The settings that matter are:
| Choice | Effect |
|---|---|
| Chart range | Changes the starting point and therefore the OBV number, not the shape of the line |
| Moving average of OBV (e.g. 20 days) | Smooths the line and gives crossover signals |
| Time frame | Weekly OBV shows longer-term accumulation or distribution |
Limitations of OBV
- All or nothing. A stock that closes one cent higher on huge volume adds all of it, as if every share were bought. Indicators such as the Accumulation/Distribution line and Chaikin Money Flow weight volume by where the close sits in the day’s range instead.
- Volume spikes. Index rebalancing days, option expirations and earnings can add or remove an unusually large block that shifts the line for months.
- Arbitrary level. Only the direction and the relative highs and lows are meaningful; comparing OBV numbers between stocks or charts is meaningless.
- Divergences can last. SPY’s OBV diverged for about two months before price fell; a divergence is a warning, not a timing signal.
- Not a prediction. Combine OBV with the trend, support and resistance and fundamentals.
Frequently asked questions
What is On-Balance Volume (OBV)?
On-Balance Volume is a running total of volume introduced by Joseph Granville in 1963. On a day the stock closes higher, that day’s volume is added; on a day it closes lower, the volume is subtracted. The idea is that volume shows whether buyers or sellers are in control, and that changes in volume can show up before changes in price.
How is OBV calculated?
If today’s close is above yesterday’s, OBV = previous OBV + today’s volume. If it is below, OBV = previous OBV − today’s volume. If the close is unchanged, OBV stays the same. The starting value is arbitrary, so only the direction of OBV matters.
What does a rising OBV mean?
A rising OBV means more volume is traded on up days than on down days, a sign of accumulation. When OBV rises along with price, it confirms the uptrend. When OBV rises while price is flat, some traders read it as buying ahead of a breakout.
What is an OBV divergence?
A divergence is a disagreement between OBV and price. A bearish divergence happens when price makes a new high but OBV does not, suggesting that volume is not supporting the advance. A bullish divergence happens when price makes a new low but OBV holds above its previous low.
Why is the OBV number so large or even negative?
OBV adds up volume from wherever the chart’s data begins, so its value depends on the starting date and can be any size, including negative. A reading of 444.82 million on one chart may be different on another. Read the trend and the highs and lows of the line, not the number itself.
What are the limitations of OBV?
OBV assigns a whole day’s volume to buyers or sellers based only on the close, so a stock that rises one cent on heavy volume adds all of it. Single huge-volume days, such as index rebalancing or earnings, can shift the line for months. It works best alongside price trends and other indicators.