- What they are
- Why levels repeat
- How to draw them
- Resistance: HD
- Support: DIS
- How traders use them
- Limitations
- FAQ
What are support and resistance?
Support is a floor: a price below the market where demand has been strong enough to stop declines before. Resistance is a ceiling: a price above the market where supply has stopped rallies before. Neither is guaranteed to hold, but each time a level stops a move, more traders notice it and plan around it.
Levels are better thought of as zones than as exact prices. A stock may turn at $357 one time and $359 the next; the line on the chart marks the area where buyers or sellers have consistently shown up.
Why price levels repeat
- Memory and regret. Buyers who bought at a high and watched the stock fall often sell when it gets back to their price. Traders who missed a low often buy when it returns there.
- Orders cluster. Limit orders, profit targets and stop losses gather around obvious highs, lows and round numbers, adding supply or demand right at the level.
- Everyone sees the same chart. Because so many traders and algorithms watch the same highs and lows, the levels become partly self-fulfilling.
How to draw support and resistance
| Step | What to do |
|---|---|
| 1. Find turns | Mark swing highs and lows where price clearly reversed, especially more than once |
| 2. Draw horizontally | Run a line through the cluster of turns and extend it to the right |
| 3. Be consistent | Use either wicks or candle bodies, not a mix |
| 4. Think in zones | Allow a small band around the line, wider for volatile stocks |
| 5. Rank the levels | More touches, longer time spans, heavier volume and round numbers make a level more important |
Other tools give levels too: moving averages act as moving support and resistance, and pivot points and Fibonacci retracement calculate them. The strongest levels are those where several of these line up with a horizontal level from past highs or lows.
Resistance on a chart: Home Depot (HD)
The daily chart of The Home Depot (HD) below covers one year, with a horizontal resistance line at $358.20.
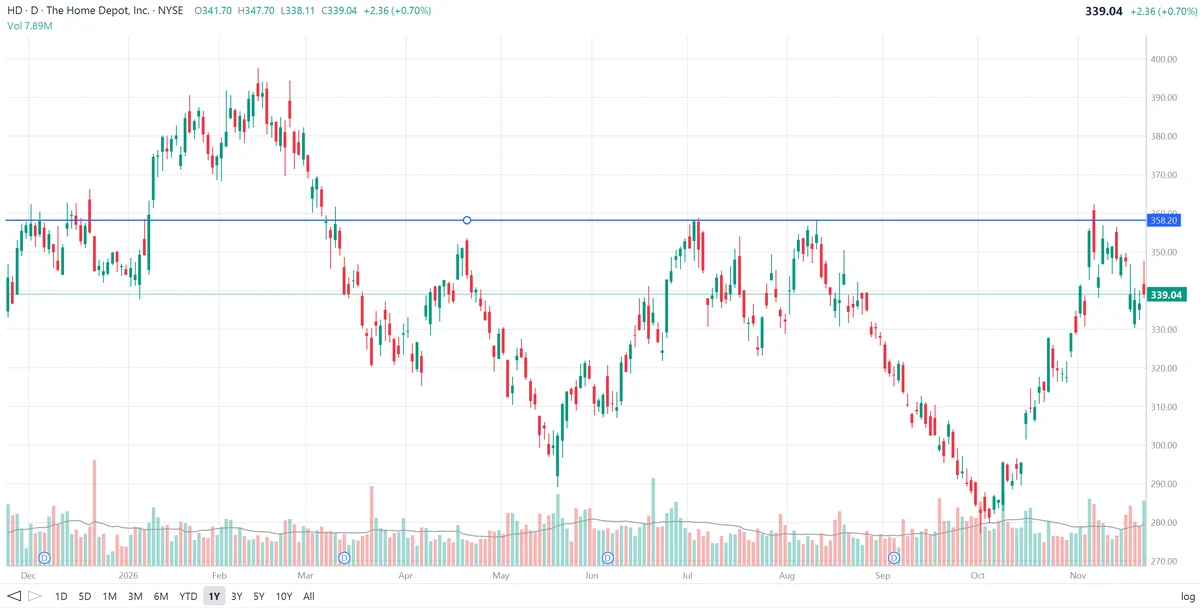
- December: a ceiling forms. Home Depot traded between about $345 and $360, and rally after rally stalled in the $358 area. One spike reached about $366 but could not hold.
- January: the breakout. In late January the stock pushed through $358 with a run of strong up days and kept going, reaching about $398 in mid-February.
- March: resistance becomes support. When Home Depot fell back in early March, the decline paused right at about $358, the old ceiling, before the level gave way in mid-March. This switch of roles is called role reversal.
- Back to resistance. After the break, $358 capped the stock again. An April rally stopped near $354, and after a low near $290 in May, Home Depot rallied to about $359 at the start of July and to about $358 in mid-August. Both times it turned down from the line. After August it fell to about $278 by early October.
- November: a false breakout. The autumn rally carried the stock to about $362 intraday in early November, just above the line, but it closed back below and has not regained it. The latest close of $339.04 is about 5% below resistance. A daily close well above $358 would be the first real break of the level since January.
Support on a chart: Walt Disney (DIS)
The daily chart of The Walt Disney Company (DIS) below covers one year, with a horizontal support line at $92.46.
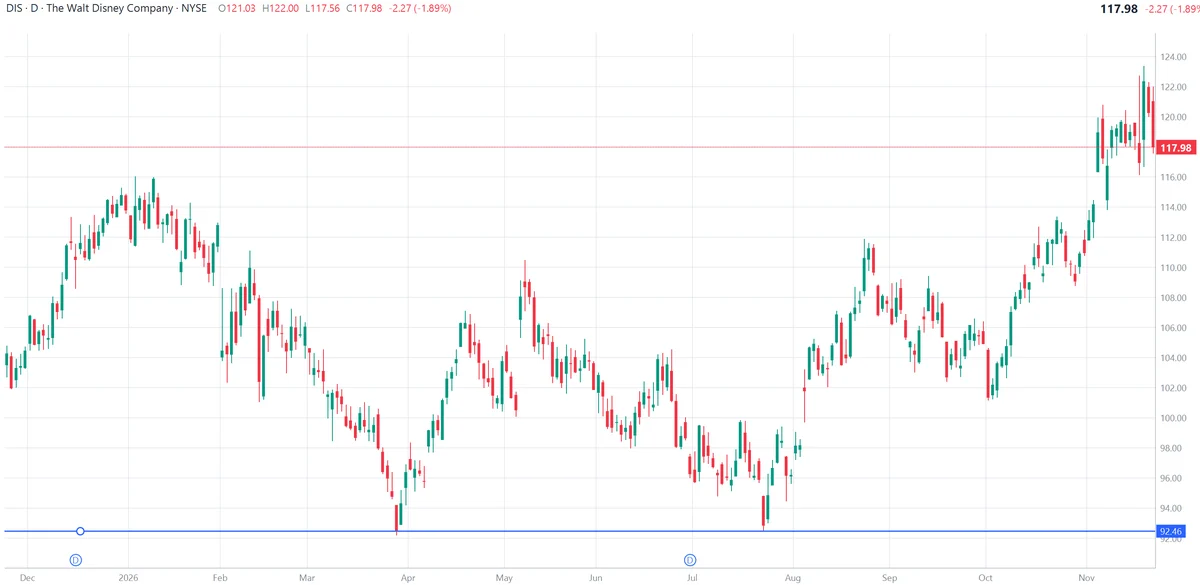
- The first low. After peaking near $116 in January, Disney fell steadily through February and March and bottomed at about $92.50 at the end of March. It rebounded to about $110 by early May.
- The second test. The stock slid again through June and July and reached the same area in late July, about $92.50. The first low had set the level; the second test, holding within a few cents, confirmed it. Two lows at the same price with a rally between them form a double bottom.
- The bounce. Disney rallied from the second low to about $112 by late August, above the roughly $110 high between the two bottoms, a sign that the double bottom had completed.
- Old resistance broken. The January highs near $116 were the next ceiling. Disney gapped above them in early November and reached about $123 in mid-November, its high for the year.
- The latest reading. The stock has eased to $117.98, still above the $116 area. If the break holds, that former resistance is the first support to watch, with $110 and the $92.46 double bottom far below.
How traders use support and resistance
1. Buying support, selling resistance
In a range, traders buy near support and sell near resistance, with a stop just beyond the level. Disney’s second test of $92.46 offered a clear entry with a tight stop.
2. Breakouts
A decisive close beyond a level, ideally on rising volume, suggests a new move is starting. Home Depot’s January break above $358 led to a rally of about $40. See breakout.
3. Role reversal
After a breakout, the old level is often retested from the other side. Buying the retest of broken resistance, as Home Depot offered at $358 in early March, is a common lower-risk entry.
4. False breakouts
Brief pokes through a level that close back inside, like Home Depot’s November spike to $362, trap breakout traders. Many traders wait for a daily close beyond the level, or a second day of follow-through, before acting.
5. Targets and stops
The next resistance above is a natural profit target for a long trade, and the nearest support below a natural place for a stop.
Limitations
- Subjective. Different traders draw slightly different lines; using zones rather than exact prices helps.
- Levels break. Every support eventually fails and every resistance is eventually overcome; the question is when.
- Stop hunting. Because so many stops sit just beyond obvious levels, price often dips through them briefly before reversing.
- Context matters. Support in a strong downtrend is weaker than support in an uptrend; check the trend first.
- Not a prediction. Levels show where reactions are likely, not what will happen; combine them with trend, volume and fundamentals.
Frequently asked questions
What are support and resistance?
Support is a price level where a falling stock has repeatedly stopped and turned up, because buyers step in there. Resistance is a level where a rising stock has repeatedly stalled and turned down, because sellers appear. Both are usually zones rather than exact prices.
How do you find support and resistance levels?
Look for prices where the chart has turned more than once: previous swing highs and lows, gaps, long consolidation ranges and round numbers. Draw a horizontal line through the area where the turns cluster, using either the wicks or the candle bodies consistently. The more touches and the longer the time span, the more traders are likely to watch the level.
What is role reversal in support and resistance?
When price breaks decisively through a level, the level often switches roles. Broken resistance tends to act as support on the next pullback, and broken support tends to act as resistance on the next rally. Traders who sold too early or bought at the old level tend to act there again.
Does more touches make a level stronger?
More touches make a level more widely watched, but each test can also use up the orders waiting there. A level that holds several times and then breaks often leads to a sharp move, because many stops sit just beyond it.
What is a false breakout?
A false breakout happens when price moves briefly beyond support or resistance, often intraday, and then closes back on the original side. Many traders wait for a close beyond the level, a follow-through day or higher volume before treating a break as real.
Are moving averages and Fibonacci levels support and resistance?
Yes, they are dynamic or calculated forms of it. Moving averages, trendlines, pivot points and Fibonacci retracement levels can all act as support or resistance, and they carry more weight when they line up with a horizontal level from past highs or lows.