- What it is
- Formula
- Worked example
- How to draw it
- Reading the chart
- How traders use it
- Limitations
- FAQ
What is Fibonacci retracement?
Trends rarely move in a straight line. A stock rallies, pulls back, then rallies again. The question every trader asks during the pullback is how deep it will go. Fibonacci retracement offers a set of reference points: a pullback of 23.6% or 38.2% of the prior move is shallow, 50% is half-way, and 61.8% or 78.6% is deep.
The ratios come from the Fibonacci sequence, 0, 1, 1, 2, 3, 5, 8, 13, 21, 34, 55, 89…, where each number is the sum of the two before it. Dividing a number by the next one approaches 0.618 (34 / 55), by the number two places later approaches 0.382 (21 / 55), and by the number three places later approaches 0.236 (21 / 89). The 78.6% level is the square root of 0.618, and 50% is included simply because traders watch half-way pullbacks.
Fibonacci retracement formula
Ratios: 0.236, 0.382, 0.5, 0.618, 0.786. High and low are the swing high and swing low of the move being measured
Worked example
A stock rallies from $100 to $150, a $50 move, and then starts to pull back.
| Level | Calculation | Price |
|---|---|---|
| 0% (high) | 150 | $150.00 |
| 23.6% | 150 − 0.236 × 50 | $138.20 |
| 38.2% | 150 − 0.382 × 50 | $130.90 |
| 50% | 150 − 0.5 × 50 | $125.00 |
| 61.8% | 150 − 0.618 × 50 | $119.10 |
| 78.6% | 150 − 0.786 × 50 | $110.70 |
| 100% (low) | 100 | $100.00 |
If the pullback stops near $131 and the stock turns up, it has retraced 38.2% of the rally, typical of a strong trend. A fall through $119 means more than 61.8% of the gain is gone, and many traders would start to doubt the uptrend.
How to draw Fibonacci retracement
- Pick a clear swing. Use a significant low and high that most traders would agree on, not small wiggles.
- Draw in the direction of the move. For a rally, start at the swing low and drag to the swing high; for a decline, start at the high and drag to the low. Charting tools label the end you finish on as 0%.
- Use the extremes. Most traders anchor on the highest high and lowest low of the move, including wicks.
- Redraw when the swing changes. When price makes a new high, the old levels describe an old move; a new swing gives new levels.
Reading Fibonacci retracement on a chart: Amgen (AMGN)
The daily chart of Amgen (AMGN) below covers one year. The retracement levels are drawn on the rally from the early-May low of $321.62 (the 100% level) to $446.09 (0%), the area of the late-August and early-September highs.
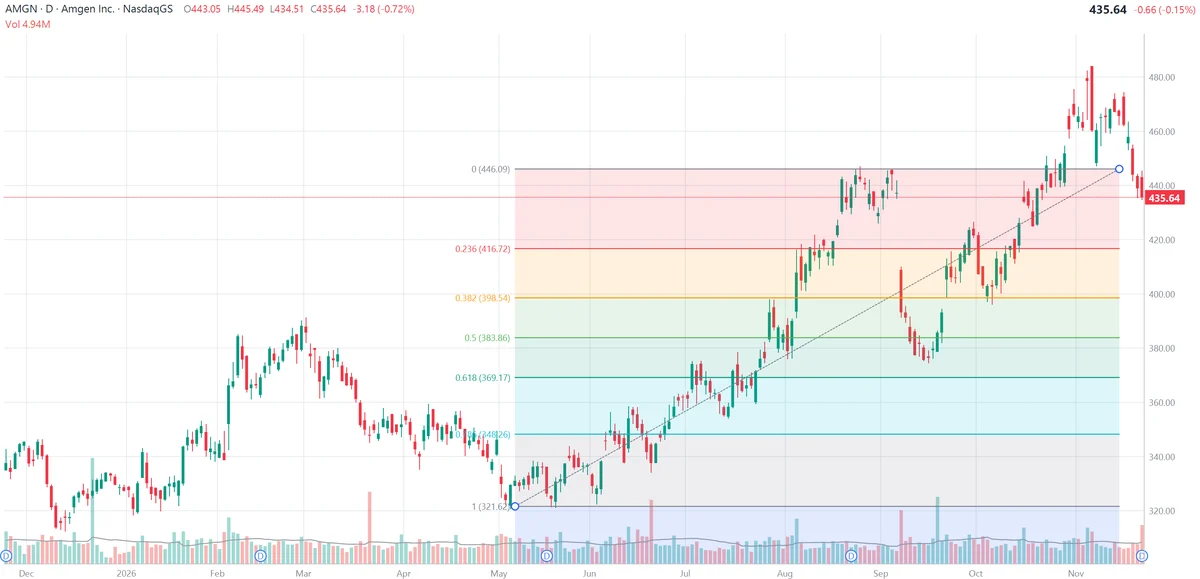
The chart’s levels match the formula: 446.09 − 0.236 × 124.47 = 416.72, − 0.382 × 124.47 = 398.54, − 0.5 × 124.47 = 383.86, − 0.618 × 124.47 = 369.17 and − 0.786 × 124.47 = 348.26.
What the levels show on this chart:
- The rally being measured. From $321.62 in early May, Amgen climbed steadily for almost four months to the $446 area at the end of August and the start of September. The dashed diagonal line on the chart connects the two anchor points.
- A deep pullback that held at the golden ratio. In September the stock fell sharply, breaking 23.6%, 38.2% and 50% and bottoming near $375 around the middle of the month. That is about a 57% retracement, between the 50% level ($383.86) and the 61.8% level ($369.17). The 61.8% level was never tested, and the stock turned up.
- A higher low at 38.2%. After bouncing above $410, Amgen dipped again in early October to about $397, almost exactly the 38.2% level ($398.54), and held. A second, shallower pullback to a Fibonacci level is a classic sign that the trend is resuming.
- Breaking the old high. In late October the stock rallied through 23.6% ($416.72) and then through the 0% level at $446.09, the old high, reaching about $484 in early November. That is close to the 127.2% extension of the May–August move, 321.62 + 1.272 × 124.47 ≈ $479.95, a level traders often use as a first target after a breakout.
- The latest reading. Amgen has fallen back to $435.64, below the old $446 high that it broke out from. On these levels, the next reference is 23.6% at $416.72. Redrawn on the newer swing from the early-October low near $397 to the November high near $484, the 50% and 61.8% retracements fall at roughly $440 and $430, and the stock is between them.
How traders use Fibonacci retracement
1. Pullback entries
In an uptrend, traders wait for a pullback to 38.2%, 50% or 61.8% and look for signs that buyers are returning, such as a bullish candle, an RSI turn from oversold or a bounce off a rising moving average, before buying.
2. Confluence
A Fibonacci level carries more weight when it lines up with something else: a previous high or low, a round number, a moving average or a pivot point. Amgen’s 38.2% level at $398.54 also sat just under the round $400.
3. Stops
A common approach is to buy near one level and place a stop just beyond the next, for example buying at 50% with a stop below 61.8%.
4. Extensions as targets
Once price breaks the prior high, extensions at 127.2%, 161.8% and 261.8% of the original move give possible targets. For Amgen’s May–August move, the 161.8% extension is 321.62 + 1.618 × 124.47 ≈ $523.
Limitations of Fibonacci retracement
- Subjective anchors. The levels depend entirely on which high and low are chosen; two traders can draw different levels on the same chart.
- Many levels, wide zone. With five levels between the high and low, a pullback will almost always stop “near” one of them.
- No proven basis in nature for markets. The ratios matter mainly because many traders watch them, which can make them self-fulfilling.
- Hindsight. On a finished chart the levels that worked stand out; in real time it is unclear which one will hold.
- Not a prediction. Combine the levels with the trend, volume and other support and resistance.
Frequently asked questions
What is Fibonacci retracement?
Fibonacci retracement is a drawing tool that places horizontal lines at fixed percentages of a price move, usually 23.6%, 38.2%, 50%, 61.8% and 78.6%. After a stock rallies from a low to a high, the lines show how far a pullback has retraced the rally, and traders watch them as possible support. After a decline, the same levels act as possible resistance on a bounce.
How are Fibonacci retracement levels calculated?
Take the swing high and swing low. For an uptrend, each level = high − ratio × (high − low). For example, after a rally from $100 to $150, the 38.2% retracement is 150 − 0.382 × 50 = $130.90 and the 61.8% retracement is 150 − 0.618 × 50 = $119.10.
Where do the Fibonacci ratios come from?
They are derived from the Fibonacci sequence (0, 1, 1, 2, 3, 5, 8, 13, 21, 34…). Dividing a number by the next one approaches 0.618, by the number two places later approaches 0.382, and by the number three places later approaches 0.236. 78.6% is the square root of 0.618. The 50% level is not a Fibonacci ratio but is included because traders watch half-way retracements.
Which Fibonacci level is the most important?
Many traders consider the 61.8% level, the golden ratio, the most important, with 38.2% and 50% close behind. Shallow pullbacks to 23.6% or 38.2% are typical of strong trends, while a break below 61.8% or 78.6% often means the original move is in doubt.
How do you draw Fibonacci retracement?
In an uptrend, click the swing low first and drag to the swing high; in a downtrend, click the swing high first and drag to the swing low. Use clear, significant turning points. The levels depend entirely on which high and low you choose, so different traders can draw different levels on the same chart.
What are Fibonacci extensions?
Extensions project levels beyond the original move, most often at 127.2%, 161.8% and 261.8% of it. After a pullback ends, traders use them as possible targets if price goes on to break the previous high.