What is the Aroon indicator?
Tushar Chande introduced Aroon in 1995; the name means “dawn’s early light” in Sanskrit, a nod to its aim of spotting new trends early. It has two lines:
- UpAroon Up100 on the day of a new high in the lookback window, then falls one step each day without one.
- DnAroon Down100 on the day of a new low in the window, then falls one step each day without one.
- ±Aroon OscillatorAroon Up minus Aroon Down, from −100 to +100. Above zero favors an uptrend, below zero a downtrend.
Unlike most indicators, Aroon ignores how far price moves. It only cares about timing: how many bars have passed since the extremes.
Aroon formula
n = lookback period (25 in Chande’s original, 14 on many charts) · the window covers today and the previous n bars
Because the count of bars is a whole number, the lines move in fixed steps of 100 / n: 4 points for a 25-period Aroon, about 7.14 points for a 14-period Aroon. That is why the lines look like saw teeth: a jump to 100 at each new extreme, then a straight-line slide.
Worked example: 14-period Aroon
Over the last 15 bars (today plus 14 before it), a stock’s highest high came 3 bars ago and its lowest low 12 bars ago.
| Line | Calculation | Value |
|---|---|---|
| Aroon Up | 100 × (14 − 3) / 14 | 78.57 |
| Aroon Down | 100 × (14 − 12) / 14 | 14.29 |
| Aroon Oscillator | 78.57 − 14.29 | +64.29 |
Recent high, old low: an uptrend. If the stock makes no new high for the next three days, Aroon Up slides to 71.43, 64.29 and 57.14, even if price barely moves. If it makes a new high tomorrow, Aroon Up jumps straight back to 100. Meanwhile the 12-bar-old low keeps ageing: in two more days it is 14 bars old and Aroon Down reaches 0, and on the third day it leaves the window. Aroon Down then reflects whichever low is now the lowest in the window, and can jump up even though nothing happened on the chart.
How to read Aroon
| Reading | Meaning |
|---|---|
| Aroon Up 70–100, Aroon Down 0–30 | Strong uptrend: new highs are recent, new lows are old |
| Aroon Down 70–100, Aroon Up 0–30 | Strong downtrend |
| Both lines below 50 | No fresh highs or lows: consolidation or a sideways market |
| Both lines high | New highs and new lows close together: a volatile, directionless market |
| Aroon Up crosses above Aroon Down | A possible new uptrend; the reverse is a possible new downtrend |
| A line holding at 100 | A new extreme on (almost) every bar: a very strong move |
Reading Aroon on a chart: Ciena (CIEN)
The daily chart of Ciena (CIEN) below covers one year. The upper panel shows price with the 10, 50 and 200-day SMAs; the lower panel shows Aroon (14): Aroon Up in green, Aroon Down in red, with guide lines at 70 and 30.
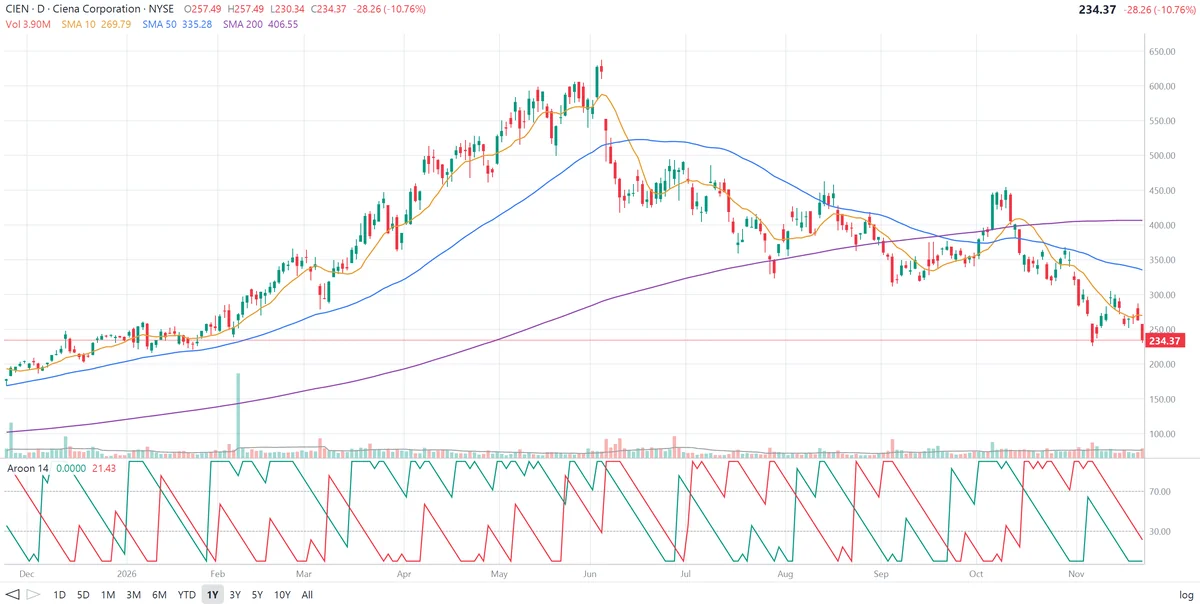
What the two lines show on this chart:
- Aroon Up in charge. From February to mid-May CIEN climbed from the low $200s to about $600. Aroon Up kept snapping back to 100 with each new high and held above 70 for long stretches in February, late March, late April and mid-May, while Aroon Down stayed mostly below 30. The short pullbacks in early March and early April show up as gaps where Aroon Up slid for a few days before the next new high.
- The top in early June. After the high near $640, there were no more new highs, so Aroon Up counted down to zero over the next 14 bars, step by step, while Aroon Down jumped to 100 as CIEN fell toward $420. June was mixed: price swung in a range and neither line held.
- Aroon Down in charge. From mid-July to early August, and again in the first week of September, Aroon Down stayed above 70 with Aroon Up near zero, as CIEN fell from about $480 to the low $300s.
- Short-lived rallies. Aroon Up took control briefly in mid-August and again from late September to early October, as CIEN bounced to about $460 and $455. Each time it faded within two weeks, and Aroon Down took over again in late October as CIEN gapped down toward $225 in early November.
- The latest reading. Aroon Up is 0: the 14-day high came on the first bar of the window, at the end of October. Aroon Down is 21.43, or 100 × (14 − 11) / 14: the 14-day low came 11 bars ago, in early November. The last bar fell 10.8% to $234.37, yet Aroon Down didn’t rise, because the day’s low of $230.34 stayed above the early-November low. Both lines are low, so by Aroon’s 14-day measure there is no fresh trend; but price is 13% below its 10-day SMA, 30% below the 50-day and 42% below the 200-day. If CIEN breaks below its early-November low within the next three bars, Aroon Down will jump straight to 100.
How traders use Aroon
1. Crossovers
Aroon Up crossing above Aroon Down is a signal that an uptrend may be starting; the reverse signals a possible downtrend. A crossover counts for more when the winning line then reaches 100.
2. Trend confirmation
Aroon Up above 70 and Aroon Down below 30 confirms an uptrend, and the opposite confirms a downtrend. Traders use this as a filter for trend-following entries, much like an ADX reading above 25.
3. Consolidation and breakouts
When both lines fall below 50, the stock isn’t making new highs or lows: a consolidation. The first line to jump back to 100 often shows which way the breakout goes.
4. Aroon Oscillator
The oscillator compresses both lines into one: above +50 favors a strong uptrend, below −50 a strong downtrend, and crosses of zero match the crossovers of the two lines.
Limitations of Aroon
- Ignores size. A new high by one cent and a new high by 20% look the same to Aroon, and a big drop that doesn’t make a new low barely registers.
- Jumps when old bars drop out. When an extreme leaves the window, the line can jump to the next-oldest extreme without any change in price.
- Short memory. With a 14-period window, Aroon can read “no trend” in the middle of a long decline, as on CIEN, which is still far below its 50 and 200-day averages.
- Whipsaws in ranges. In a choppy market new highs and lows alternate and the lines cross often.
- Not a prediction. Confirm with price action, volume, support and resistance, and the company’s fundamentals.
Frequently asked questions
What is the Aroon indicator?
Aroon, developed by Tushar Chande in 1995, measures how recently a stock made its highest high and lowest low over a lookback period. Aroon Up is high when the latest high was recent, Aroon Down is high when the latest low was recent, and together they show whether a trend is starting, running or fading.
How is Aroon calculated?
Aroon Up = 100 × (n − periods since the n-period high) / n and Aroon Down = 100 × (n − periods since the n-period low) / n. A new high today gives Aroon Up 100; a high n periods ago gives 0.
What do Aroon readings above 70 and below 30 mean?
Aroon Up above 70 with Aroon Down below 30 points to a strong uptrend: new highs are recent and new lows are old. The opposite points to a strong downtrend. When both lines are below 50, the stock is usually moving sideways.
What is the Aroon Oscillator?
The Aroon Oscillator is Aroon Up minus Aroon Down, ranging from −100 to +100. Positive values favor an uptrend, negative values a downtrend, and a cross through zero matches a crossover of the two Aroon lines.
What period should I use for Aroon?
Chande’s original period was 25. Many charting tools default to 14, which reacts faster. With period n, the lines move in steps of 100/n, so a 14-period Aroon moves in steps of about 7.14 points.
Why does Aroon not react to a big down day?
Aroon only cares about when the highest high and lowest low occurred, not how far price moves. A sharp drop that does not take out the recent low leaves Aroon Down unchanged, apart from its daily decline as the old low ages.