What is the Awesome Oscillator?
AO asks whether the last five bars are trading above or below the last 34 bars, and by how many dollars. When the short average of the midpoint is above the long one, AO is positive and the recent move is up; when it is below, AO is negative. The further from zero, the stronger the move.
The idea is the same as MACD: a fast average minus a slow average. AO differs in three ways: it uses the bar’s midpoint instead of the close, simple averages instead of exponential ones, and fixed 5 and 34-bar lengths. It has no signal line. The colour of each bar does that job: green when AO is higher than on the previous bar, red when it is lower.
Awesome Oscillator formula
Bar is green if AOt > AOt−1, red if AOt < AOt−1
AO is measured in the stock’s price units, so a reading of 16.84 on a $340 stock means the 5-bar average midpoint is about $16.84 above the 34-bar average midpoint. That also means AO values cannot be compared directly between a $30 stock and a $300 stock.
Worked example
A real AO needs 34 bars, which makes a long table. The steps are the same with shorter averages, so this example uses a 3-bar and a 6-bar SMA of the midpoint over eight days.
| Day | High | Low | Median |
|---|---|---|---|
| 1 | $52 | $50 | 51.0 |
| 2 | $53 | $51 | 52.0 |
| 3 | $54 | $51 | 52.5 |
| 4 | $53 | $50 | 51.5 |
| 5 | $55 | $52 | 53.5 |
| 6 | $56 | $53 | 54.5 |
| 7 | $55 | $52 | 53.5 |
| 8 | $54 | $52 | 53.0 |
| Day | 3-bar SMA | 6-bar SMA | Oscillator | Bar |
|---|---|---|---|---|
| 6 | (51.5 + 53.5 + 54.5) / 3 = 53.17 | 315 / 6 = 52.50 | +0.67 | first value |
| 7 | (53.5 + 54.5 + 53.5) / 3 = 53.83 | 317.5 / 6 = 52.92 | +0.92 | green (higher) |
| 8 | (54.5 + 53.5 + 53.0) / 3 = 53.67 | 318.5 / 6 = 53.08 | +0.58 | red (lower) |
On day 8 the oscillator is still positive, because the last three midpoints are above the six-bar average, but the bar turns red because the gap narrowed. That is the most common AO reading near a short-term top: still above zero, but shrinking.
Reading AO on a chart: Home Depot (HD)
The daily chart of The Home Depot (HD) below covers one year. The upper panel shows price with the 10, 50 and 200-day SMAs and volume; the lower panel shows the Awesome Oscillator (5, 34).
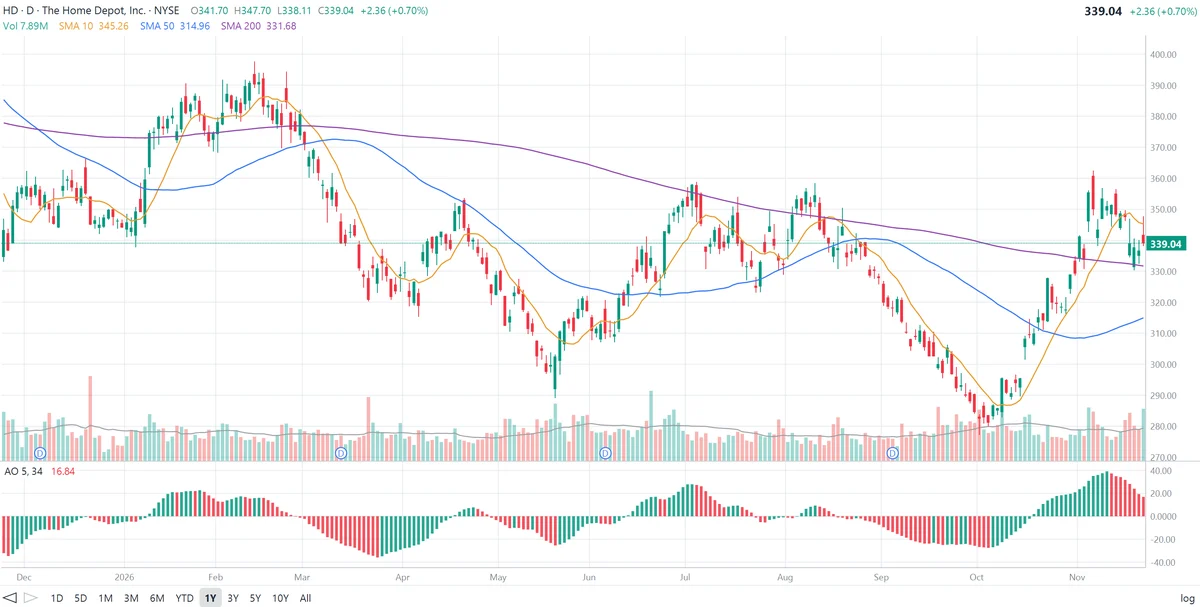
The last bar’s midpoint is (347.70 + 338.11) / 2 = $342.91. An AO of 16.84 means the five most recent midpoints average about $17 more than the last 34. The bar is red because that gap is smaller than it was a day earlier.
What AO shows on this chart:
- Bearish twin peaks in January and February. AO crossed above zero in early January as Home Depot climbed toward $390 and peaked at about +23 in late January. It pulled back to about +12 without crossing zero, then made a second, lower peak of about +17 in mid-February, while the stock made its high for the year near $398. The lower second peak, followed by red bars, was the classic twin-peaks warning. AO crossed below zero at the start of March and Home Depot fell to about $315.
- The deepest reading. AO reached about −36 in late March, its lowest point of the year, as the decline was at its fastest. The bars turned green within days, well before AO got back to zero: the selling was slowing even though the stock was still below its averages. AO crossed above zero in mid-April as HD bounced to about $353.
- The May low. A second slide took AO to about −25 in late May and Home Depot to its low of the year near $290. Green bars from late May again flagged the turn before the zero cross in mid-June.
- A bullish saucer in June. With AO above zero at about +17, two red bars (15.0, then 14.7) were followed by a green bar in late June. That is Williams’ saucer: a brief pause in rising momentum, then a resumption. AO climbed to about +28 in early July and the stock reached about $358.
- Fading highs in the summer. When Home Depot returned to about $358 in mid-August, AO peaked at only about +9, far below the July high. Price matched its high; momentum did not. AO went negative again in late August.
- The autumn decline and rally. AO stayed negative from late August to mid-October, bottoming at about −28 in early October as the stock fell to about $280. Green bars started in the first week of October, AO crossed zero around mid-October, and it rose to about +39 in early November, the highest reading of the year, as HD rallied to about $362.
- The latest reading. Since that peak, every bar has been red: AO has fallen from about +39 to 16.84. It is still well above zero, so the 5-bar average is still above the 34-bar average, but the gap has more than halved. Price has slipped below the 10-day SMA while staying above the 50 and 200-day.
How traders use the Awesome Oscillator
1. Zero-line cross
AO crossing above zero means the 5-bar average midpoint has moved above the 34-bar average: a bullish signal. Crossing below zero is bearish. Because both averages are simple and short, crosses come late in sharp reversals and often in sideways markets.
2. Saucer
A bullish saucer forms above zero: two red bars in a row, the second lower than the first, then a green bar. A bearish saucer forms below zero: two green bars, the second higher, then a red bar. The saucer looks for the trend to resume after a short pause, so it gives earlier entries than the zero cross.
3. Twin peaks
A bearish twin peaks forms above zero: a peak, a pullback that stays above zero, and a second, lower peak followed by a red bar. A bullish twin peaks is the mirror image below zero, with a higher second trough followed by a green bar. Twin peaks is a divergence signal, and it carries most weight when price makes a new high or low at the second peak, as Home Depot did in February.
4. Colour as an early warning
The first red bar after a strong positive run, or the first green bar after a deep negative run, shows that momentum has turned before AO reaches zero. On its own it is not a trade signal; strong trends produce many short colour changes.
5. Accelerator Oscillator
Williams also built the Accelerator Oscillator (AC) from AO: AC = AO − SMA5(AO). It measures how fast AO itself is changing and turns earlier still.
AO settings
| Setting | Use |
|---|---|
| 5, 34 (default) | Williams’ original lengths; used on almost all charting platforms |
| Shorter, e.g. 3, 21 | Faster and noisier; more saucers and colour changes |
| Longer, e.g. 10, 50 | Slower and smoother; fewer, later signals |
Most traders keep 5 and 34 and change the chart’s time frame instead, using AO on weekly bars for longer-term momentum and on intraday bars for short-term trades.
Limitations of the Awesome Oscillator
- Not comparable across stocks. AO is in dollars, so its size depends on the share price. Judge readings against the stock’s own history.
- No fixed overbought or oversold levels. AO is unbounded; a reading of +39 is high for Home Depot but would be small for a much more expensive stock.
- Lag. The 34-bar average is slow, so zero-line crosses usually come after a good part of the move.
- Noise in ranges. In a sideways market AO hovers around zero and its colours flip often.
- Not a prediction. Combine AO with the trend, support and resistance, volume and fundamentals.
Frequently asked questions
What is the Awesome Oscillator?
The Awesome Oscillator (AO) is a momentum indicator created by Bill Williams. It is the difference between a 5-period and a 34-period simple moving average of the median price, (high + low) / 2, drawn as a histogram around a zero line. Positive values mean recent prices are above the longer-term average; negative values mean they are below it.
How is the Awesome Oscillator calculated?
First find each bar’s median price, (high + low) / 2. Then AO = SMA(5) of the median price − SMA(34) of the median price. A bar is green when AO is higher than on the previous bar and red when it is lower.
What do the green and red bars mean?
The colour shows the direction of change, not the sign. A green bar means AO rose from the previous bar and a red bar means it fell, whether the bar is above or below zero. Red bars above zero mean upward momentum is fading; green bars below zero mean downward momentum is fading.
What is the Awesome Oscillator saucer signal?
A bullish saucer happens above the zero line: two red bars in a row, the second lower than the first, followed by a green bar. It marks a short pause in upward momentum that resumes. A bearish saucer is the mirror image below zero: two green bars, the second higher, followed by a red bar.
What is the Awesome Oscillator twin peaks signal?
A bearish twin peaks forms above zero when AO makes a peak, pulls back without crossing zero, then makes a second, lower peak and turns red. A bullish twin peaks forms below zero with a second, higher trough followed by a green bar. Both are a form of divergence between AO and price.
What is the difference between the Awesome Oscillator and MACD?
Both subtract a slow moving average from a fast one. MACD uses 12 and 26-period exponential moving averages of the close and adds a signal line. AO uses 5 and 34-period simple moving averages of the median price and has no signal line; its bar colours show the direction of change instead.